
Gold’s Structural Repricing: A Fiscal-Driven Regime Shift
The defining feature of gold’s advance from 2025 into 2026 has not been the magnitude of its rallies, but the market’s behavior during and after corrective phases. Repeated drawdowns of $100–$200 have failed to generate downside continuation. Instead, selling pressure has been systematically absorbed near technical support zones, with demand re-emerging before price discovery can migrate materially lower. This pattern is indicative of structural sponsorship rather than transient speculative participation.
Such price action is inconsistent with the terminal phase of a crowded momentum trade. Rather than exhibiting convex downside risk through liquidation cascades, the market has demonstrated controlled mean reversion toward support, followed by consolidation and base formation at progressively higher levels. These pauses function as balance-sheet resets—clearing marginal positioning while preserving the underlying trend—characteristic of allocation-driven markets rather than leverage-driven ones.
Importantly, buying interest has not manifested as reactive momentum chasing but as patient bid placement aligned with longer-term macro considerations. This reflects a shift in gold’s demand function away from event-driven hedging and toward strategic portfolio insurance. The persistence of this behavior suggests that gold is being accumulated as a response to systemic fiscal dynamics rather than episodic geopolitical risk.
While short-term volatility has been amplified by geopolitical developments and political interference in monetary policy—ranging from Middle Eastern tensions to evolving central bank credibility—these factors explain little of the trend’s durability. They introduce tactical noise, not structural direction. The dominant driver remains the repricing of sovereign risk in an environment of sustained fiscal deficits, rising debt servicing costs, and diminishing policy flexibility.
At its core, this cycle represents a fiscal adjustment process rather than a conventional monetary tightening or crisis-driven flight to safety. Public sector balance sheets have transitioned from abstract future liabilities to immediate macro constraints. As debt accumulation collides with adverse demographic profiles and political resistance to fiscal consolidation, confidence in long-term policy sustainability has weakened. Gold, in this context, is being revalued as a hedge against balance-sheet deterioration rather than as a volatility hedge.
This framework explains why corrective phases have consistently attracted incremental demand. In a purely speculative environment, downside volatility would induce forced deleveraging and trend failure. Instead, drawdowns have reinforced participation from longer-horizon investors whose allocation decisions are insensitive to short-term positioning metrics or overbought technical signals. Crowding, where present, has increased price volatility without undermining the trend’s structural integrity.
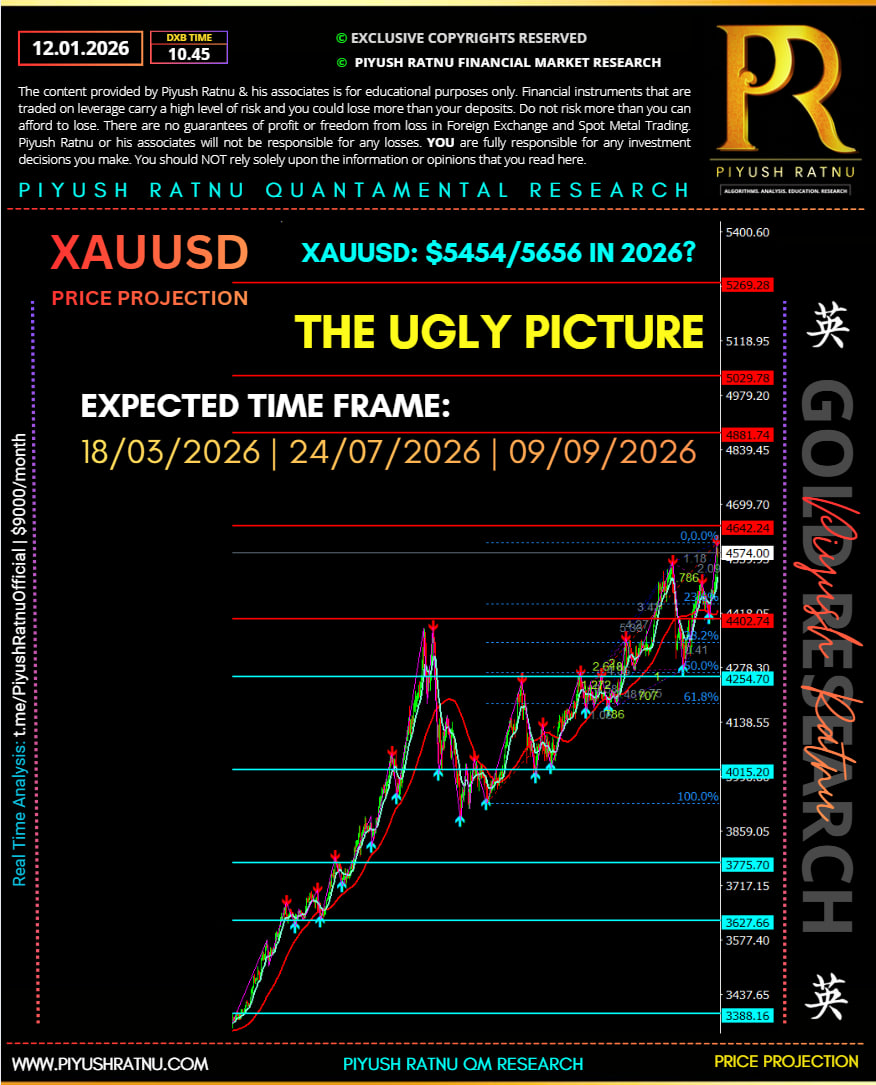
Under these conditions, price targets previously considered implausible—such as $5,555—can no longer be dismissed as purely extrapolative. The path toward such levels is unlikely to be linear and will involve periods of congestion and drawdown. However, the growing consensus labeling gold as “overvalued” is more indicative of hindsight validation than imminent reversal. Mature trends often encounter heightened skepticism precisely because their logic has become visible.
Yield curve control and other volatility-suppression mechanisms have temporarily stabilized rates markets, but they function as circuit breakers rather than solutions. They reallocate duration risk without resolving the fundamental challenge of balance-sheet normalization. These unresolved tensions migrate across jurisdictions—Japan, the United States, and eventually other developed sovereigns—leaving residual uncertainty even after localized stress episodes subside.
As a result, fiscal risk has evolved into a rolling macro theme rather than a discrete shock event. Gold does not require a persistent crisis to remain supported; it requires periodic reinforcement of the constraints facing sovereign finance. In such an environment, gold continues to be repriced as an insurance premium against systemic fiscal degradation. Provided that corrective phases resolve through consolidation rather than structural breakdown, the implication remains unchanged: the trend reflects an ongoing reassessment of sovereign risk and remains intact.
Stress-Testing the Fiscal Repricing Thesis for Gold
To invalidate the current structural gold thesis, one or more of the following conditions would need to materialize in a persistent and coordinated manner, not as isolated or temporary events.
1. Credible Fiscal Consolidation in Core Sovereigns
Failure Condition:
Large developed economies—principally the United States—would need to demonstrate sustained deficit reduction through politically durable fiscal consolidation.
Why This Matters:
Gold’s repricing is predicated on the erosion of confidence in sovereign balance-sheet sustainability. A credible medium-term path toward stabilizing debt-to-GDP ratios would directly reduce the demand for gold as fiscal insurance.
Stress Test Outcome:
This would require:
-
binding fiscal rules with enforcement credibility
-
politically viable entitlement reform
-
real (not inflation-assisted) debt stabilization
Absent these, temporary deficit improvements driven by cyclical growth or accounting effects would be insufficient to alter long-term allocation behavior.
2. Positive Real Rates Without Financial Repression
Failure Condition:
Central banks would need to maintain meaningfully positive real interest rates without destabilizing public finances, asset markets, or banking systems.
Why This Matters:
Gold’s opportunity cost is most sensitive to real yields. A durable regime of positive real returns on sovereign debt would reassert bonds as a credible store of value.
Stress Test Outcome:
This scenario assumes:
-
debt servicing costs remain manageable
-
no reintroduction of yield caps, QE, or balance-sheet expansion
-
limited financial stress in rate-sensitive sectors
Historically, such regimes have been difficult to sustain once debt levels exceed certain thresholds.
3. Re-Anchoring of Policy Credibility
Failure Condition:
Monetary and fiscal authorities would need to restore confidence that long-term policy objectives will not be subordinated to political imperatives.
Why This Matters:
Gold is increasingly reflecting skepticism about institutional independence rather than inflation per se.
Stress Test Outcome:
This would require:
-
demonstrable central bank autonomy
-
clear separation between fiscal financing and monetary operations
-
consistent policy signaling over multiple cycles
Single-cycle credibility improvements would not materially change gold’s strategic role.
4. Sustained Disinflation Without Growth Impairment
Failure Condition:
Inflation would need to normalize toward target levels without triggering recessionary dynamics that force policy reversal.
Why This Matters:
If inflation falls organically while growth remains resilient, the case for gold as a hedge against policy instability weakens.
Stress Test Outcome:
The challenge lies in achieving disinflation without:
-
debt-deflation dynamics
-
labor market stress
-
renewed fiscal stimulus
If disinflation is achieved only through demand destruction, gold’s insurance role remains intact.
5. Structural Decline in Official-Sector Gold Demand
Failure Condition:
Central banks—particularly in EM and reserve-diversifying economies—would need to reduce or reverse gold accumulation.
Why This Matters:
Official-sector demand has reinforced gold’s role as a neutral reserve asset amid geopolitical and currency fragmentation.
Stress Test Outcome:
A sustained reversal would require:
-
renewed confidence in reserve currencies
-
reduced geopolitical fragmentation
-
diminished sanctions risk
Absent these conditions, central bank gold demand is likely to remain structurally supportive.
6. Orderly Debt Monetization Without Confidence Loss
Failure Condition:
Governments would need to successfully monetize debt while maintaining currency stability and investor confidence.
Why This Matters:
If debt expansion can be absorbed without erosion of purchasing power or capital flight, gold’s hedge value diminishes.
Stress Test Outcome:
This is theoretically possible but historically rare, particularly at current debt levels and demographic profiles.
7. Technical Breakdown Accompanied by Flow Reversal
Failure Condition:
Gold would need to violate long-term structural support levels while exhibiting evidence of allocation-level selling.
Why This Matters:
Price alone is insufficient; the thesis fails only if supported by:
-
ETF outflows
-
central bank selling
-
sustained forward curve inversion
-
rising real yields with stable growth
Absent corroborating flow data, technical drawdowns remain corrective rather than terminal.
Synthesis: What Would Actually Break the Thesis?
The gold repricing thesis fails not on volatility, headlines, or cyclical tightening, but only if the following occur simultaneously:
Fiscal discipline is restored
Real yields remain structurally positive
Policy credibility is re-anchored
Debt is normalized without repression or inflation
Official demand recedes
Short of this coordinated regime shift, gold remains positioned not as a speculative asset, but as a balance-sheet hedge against unresolved sovereign risk.
In practical terms, the burden of proof lies with policymakers, not price action. Until fiscal constraints demonstrably ease, corrective phases should be interpreted as consolidation rather than trend failure.
Quantified Stress Test: XAUUSD Scenario Matrix (2025–2026)
The table below translates the thesis and its failure conditions into explicit price regimes, macro triggers, and probability weights. Probabilities are subjective but grounded in current fiscal, rate, and policy constraints.
Scenario 1: Structural Fiscal Repricing Continues (Base Case)
Probability: 55%
Macro Conditions
-
Persistent large fiscal deficits in the US and developed markets
-
Debt servicing costs remain politically sensitive
-
Real rates fluctuate but cannot stay structurally positive
-
Periodic financial repression (implicit or explicit)
-
Continued central bank gold accumulation
Market Behavior
-
Pullbacks remain corrective and shallow
-
Volatility rises, but trend structure holds
-
Demand driven by allocation, not leverage
XAUUSD Price Implications
-
Support: 4,450–4,600
-
Trading Range: 4,700–5,200
-
Upside Extension: 5,400–5,600
Interpretation
Gold continues to be repriced as fiscal insurance. $5,500 is reached through consolidation and frustration, not euphoria. This is the most likely path given current policy constraints.
Scenario 2: Accelerated Fiscal Stress / Financial Repression
Probability: 20%
Macro Conditions
-
Failed Treasury auctions or disorderly duration markets
-
Yield curve control, renewed QE, or balance-sheet expansion
-
Explicit monetization narratives gain traction
-
Currency volatility increases
Market Behavior
-
Gold decouples from real rates
-
Pullbacks become brief and aggressively bid
-
Momentum and allocation align
XAUUSD Price Implications
-
Support: 4,800–5,000
-
Breakout Zone: 5,300–5,500
-
Overshoot Risk: 5,800–6,200
Interpretation
This is not panic buying—it’s loss of confidence in duration assets. Gold trades as a monetary asset rather than a commodity. Volatility increases sharply, but downside corrections are minimal.
Scenario 3: Orderly Disinflation + Policy Credibility Restoration
Probability: 15%
Macro Conditions
-
Inflation returns to target without recession
-
Real yields stabilize at +1.5% to +2%
-
Fiscal rhetoric improves, though debt remains high
-
No financial repression
Market Behavior
-
Gold loses marginal allocation appeal
-
Pullbacks extend further and take longer to resolve
-
Volatility compresses
XAUUSD Price Implications
-
Resistance: 4,900–5,100
-
Mean Reversion Zone: 4,000–4,300
-
Structural Floor: ~3,800
Interpretation
This is the cleanest bearish case—and still not a collapse. Gold reprices lower as insurance premiums shrink, but remains structurally elevated versus pre-2020 norms.
Scenario 4: Hard Fiscal Discipline + Sustained Positive Real Rates
Probability: 7%
Macro Conditions
-
Binding fiscal consolidation
-
Entitlement reform
-
Politically durable debt reduction
-
Sustained positive real yields without market stress
Market Behavior
-
Long-term allocation flows reverse
-
ETFs and official sector reduce exposure
-
Gold trades as opportunity-cost asset again
XAUUSD Price Implications
-
Breakdown Level: <3,800
-
Repricing Range: 3,000–3,400
-
Cycle Low Risk: 2,700–2,900
Interpretation
This is the true thesis failure, but it requires a coordinated policy regime shift that has been historically rare at current debt levels.
Scenario 5: Deflationary Shock / Liquidity Event
Probability: 3%
Macro Conditions
-
Credit event or systemic deleveraging
-
USD funding stress
-
Forced asset liquidation
Market Behavior
-
Gold sells off initially with risk assets
-
Rapid recovery as policy response follows
XAUUSD Price Implications
-
Initial Drawdown: 3,600–3,900
-
Policy Response Bounce: back above 4,500
Interpretation
Short-term downside risk exists, but it reinforces—not breaks—the structural case once policy reaction begins.
Probability-Weighted Expected XAUUSD Range (2026)
-
Weighted Mean Price: ~5,050
-
Skew: Positively asymmetric
-
Fat Tail: Upside > downside
Key Structural Levels
-
Trend Invalidation Zone: Sustained <3,800 with confirmed allocation outflows
-
Trend Confirmation Zone: Repeated acceptance above 5,200
-
Convexity Zone: >5,500 (volatility expands sharply)
Bottom Line (Analyst Summary)
The dominant risk to gold is not valuation, but a coordinated restoration of fiscal and monetary credibility. The probability-weighted distribution favors continued structural support with upside skew. Pullbacks remain signals of consolidation unless accompanied by policy regime change and allocation-level flow reversals.
In short:
Gold below 4,000 requires discipline.
Gold above 5,500 requires stress.
Current policy trajectories favor the latter over the former.
———————————————————————————
XAUUSD Price Zones Mapped to Macro Operating Conditions
This framework links price acceptance to macro regime confirmation, not headlines.
Zone 1: < 3,800 — Structural Thesis Failure Zone
Macro Conditions Required
-
US real 10Y yields sustain > +2.0%
-
Fiscal deficit narrows below 4% of GDP with legislation, not projections
-
Treasury auctions clear without tail risk
-
No QE, no YCC, no balance-sheet expansion
-
Central banks halt or reverse gold purchases
Market Signals
-
ETF outflows persist > 3 months
-
Gold underperforms real yields and USD simultaneously
-
Volatility compresses, not spikes
Interpretation
This zone requires discipline and credibility.
Absent policy reform, price should not stay here.
Probability: very low
This is the true model invalidation
Zone 2: 3,800 – 4,300 — Orderly Disinflation / Insurance Compression
Macro Conditions
-
Inflation glides to target without recession
-
Real yields stabilize +1.25% to +1.75%
-
Fiscal rhetoric improves, but debt stock remains high
-
No repression, no crisis
Market Signals
-
Gold ranges, fails to make higher highs
-
Pullbacks deepen but remain orderly
-
Correlation with real rates reasserts
Interpretation
Insurance premium shrinks, but does not collapse.
Gold reprices lower, not broken.
Probability: moderate but fragile
Zone 3: 4,450 – 4,600 — Structural Support / Allocation Floor
Macro Conditions
-
Deficits persist > 6% of GDP
-
Debt servicing politically sensitive
-
Real yields unstable, oscillating
-
Central banks remain net buyers
Market Signals
-
Repeated dip-buying
-
No cascade selling on $100–200 drops
-
Backwardation risk appears intermittently
Interpretation
This is where long-term capital steps in.
Failure to break here confirms structural sponsorship.
Probability: high
This is the market’s “memory” level
Zone 4: 4,700 – 5,200 — Repricing & Consolidation Zone
Macro Conditions
-
Fiscal stress acknowledged but managed
-
Policy flexibility shrinking
-
Duration risk redistributed quietly
Market Signals
-
Sideways grind, elevated volatility
-
Overvaluation narratives proliferate
-
Pullbacks become time-based, not price-based
Interpretation
Gold is being revalued, not chased.
This is where frustration builds positions.
Probability: highest
Base-case regime
Zone 5: 5,300 – 5,600 — Fiscal Stress Recognition Zone
Macro Conditions
-
Failed or weak Treasury auctions
-
YCC/QE rhetoric resurfaces
-
Political interference in monetary policy
-
FX volatility rises
Market Signals
-
Pullbacks shorten
-
Momentum aligns with allocation
-
Gold decouples from real rates
Interpretation
Markets begin pricing duration risk explicitly.
This is not panic — it’s loss of confidence.
Probability: rising
Zone 6: > 5,600 — Convexity / Repression Risk Zone
Macro Conditions
-
Explicit or implicit debt monetization
-
Yield caps or balance-sheet expansion
-
Currency credibility questioned
Market Signals
-
Volatility expansion
-
Shallow corrections
-
Gold trades as monetary anchor, not asset
Interpretation
This is where gold stops behaving like a commodity
and starts behaving like shadow money.
Probability: low, but asymmetric upside
One-Page Signal Summary
-
< 3,838: credibility restored → gold loses purpose
-
3,838–4,343: insurance cheaper, still needed
-
4,444–4,6646: allocation floor — trend intact
-
4,747–5,252: repricing through frustration
-
5,353–5,555-5656: fiscal stress acknowledged
-
> 5,656: repression priced, volatility explodes
Final Analyst Take
Gold does not need crisis to stay bid.
It needs constraints.
As long as price consolidates above 4,450 and policy avoids discipline, the dominant macro regime remains upward-biased with positive convexity.
———————————————————————————-
XAUUSD Macro Alignment Matrix
(Price Zones × Observable Data × Confirmation Signals)
This framework answers one question continuously:
“Is price confirming macro, or is macro about to catch up to price?”
ZONE 1: < 3,800 — Structural Breakdown / Thesis Failure
Required Data Alignment
-
US 10Y Real Yield: sustained > +2.0% (3M+ duration)
-
US Fiscal Deficit: < 4% of GDP, legislated
-
Treasury Auctions: no tails, strong bid-to-cover
-
Fed Balance Sheet: flat or contracting
-
Central Bank Gold: net selling (YoY)
Weekly / Monthly Data to Watch
-
10Y TIPS yield (daily)
-
US Treasury Quarterly Refunding Announcement (QRA)
-
CBO deficit updates
-
IMF COFER reserves
-
World Gold Council CB purchase data
Interpretation:
If price holds here without these confirmations → false breakdown.
ZONE 2: 3,800–4,300 — Orderly Disinflation / Insurance Compression
Required Data Alignment
-
CPI / Core PCE: trending to target without unemployment spike
-
Real Yields: stable +1.25% to +1.75%
-
GDP Growth: trend-like (1.5–2.0%)
-
Fiscal Tone: rhetorical improvement, not structural reform
Data Triggers
-
CPI, Core PCE (MoM trend)
-
NFP + unemployment rate
-
ISM services (prices paid)
-
Treasury term premium (ACM model)
Interpretation:
Gold reprices lower but does not collapse.
Failure to sustain this zone = macro not credible.
ZONE 3: 4,450–4,600 — Structural Allocation Floor
Required Data Alignment
-
Fiscal Deficit: persistently > 6% of GDP
-
Debt Servicing: interest expense political headline
-
Real Yields: volatile, regime-unstable
-
Central Banks: steady net accumulation
Data to Monitor
-
US interest expense / receipts ratio
-
Congressional Budget Office (CBO) debt trajectory
-
CB gold purchase quarterly updates
-
Gold forward rates (GOFO/backwardation risk)
Interpretation:
Repeated defense of this zone = allocation sponsorship confirmed.
This is the most important validation level.
ZONE 4: 4,700–5,200 — Fiscal Repricing / Consolidation
Required Data Alignment
-
Treasury Auctions: rising tails, weak indirect bids
-
Fed Communication: increased sensitivity to fiscal conditions
-
Real Yields: oscillating, no sustained uptrend
-
USD: range-bound, volatility creeping higher
Key Data Prints
-
2Y / 10Y auction results
-
FOMC dot plots & minutes
-
MOVE index
-
DXY vs gold correlation shifts
Interpretation:
Gold trades time, not price.
Overvaluation narratives peak here.
ZONE 5: 5,300–5,600 — Fiscal Stress Recognition
Required Data Alignment
-
Auction Stress: failed or heavily tailed auctions
-
Policy Language: YCC/QE discussed openly
-
FX Volatility: rising in reserve currencies
-
Curve Control: implicit or explicit
Data to Watch Closely
-
Treasury bid-to-cover ratios
-
Fed speeches referencing “market functioning”
-
USDJPY volatility (early repression signal)
-
BOJ / ECB balance-sheet signals
Interpretation:
Gold decouples from real rates.
Pullbacks shorten dramatically.
ZONE 6: > 5,600 — Repression / Convexity Zone
Required Data Alignment
-
Explicit Monetization: balance-sheet expansion resumes
-
Yield Caps: formal or de facto
-
Currency Confidence: openly questioned
-
Inflation Tolerance: policy-admitted
Confirmation Data
-
Fed balance sheet growth (weekly H.4.1)
-
Yield volatility suppression
-
FX intervention announcements
-
Gold backwardation persistence
Interpretation:
Gold trades as shadow monetary asset.
Volatility expands; downside convexity collapses.
LIVE WEEKLY DASHBOARD (WHAT ACTUALLY MATTERS)
Every Week
-
10Y real yield trend
-
Treasury auction tails
-
Fed balance sheet
-
Gold ETF flows
Every Month
-
CPI / Core PCE
-
Interest expense vs receipts
-
Central bank gold data
-
MOVE & FX vol
Every Quarter
-
QRA issuance mix
-
CBO deficit updates
-
IMF reserve composition
Final Analyst Rulebook
-
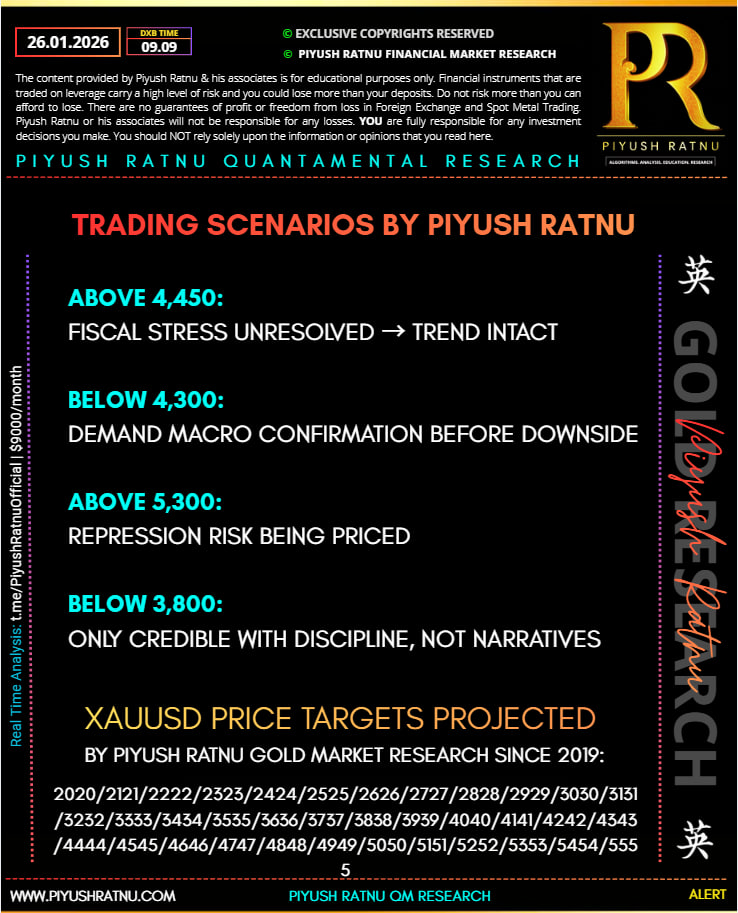
Above 4,444: fiscal stress unresolved → trend intact
-
Below 4,343: demand macro confirmation before believing downside
-
Above 5,353: repression risk being priced
-
Below 3,838: only credible with discipline, not narratives
———————————————————————————
Plain-English Translation: What These Gold Levels Actually Mean
This framework answers one simple question:
“What has to be true in the real economy for gold to live at each price level?”
Below $3,800 — The Gold Story Is Broken
For gold to stay down here, governments would have to get their act together.
That means:
-
Real interest rates stay high for years
-
Deficits are genuinely cut by law, not promises
-
Debt becomes manageable without printing money
-
Central banks stop buying gold
If gold ever sits here without those things happening, it’s a fake move.
This is the only zone where the long-term thesis truly fails.
$3,800–$4,300 — “Things Are Better, But Not Fixed”
Here, inflation cools down smoothly and the economy doesn’t break.
-
Rates are positive but not crushing
-
Growth continues
-
Governments talk responsibly, but debt is still huge
Gold becomes cheaper insurance — not useless insurance.
It’s a pullback, not a collapse.
$4,450–$4,600 — The Line in the Sand
This is the most important level.
It means:
-
Deficits are still large
-
Debt payments are politically painful
-
Central banks quietly keep buying gold
-
Every sell-off finds buyers
If gold keeps bouncing here, it’s proof that big money is treating gold as permanent protection, not a trade.
$4,700–$5,200 — The “Frustration Zone”
Nothing explodes here — and that’s the point.
-
Governments manage problems, not solve them
-
Rates go up and down, but never stay high
-
People argue gold is “overvalued”
Gold moves sideways and annoys everyone.
This is where long-term positions get built quietly.
$5,300–$5,600 — Markets Start Getting Nervous
Now stress is being admitted, not hidden.
You’ll see:
-
Weak government bond auctions
-
Talk about controlling yields or restarting money printing
-
Currency volatility creeping in
Gold stops caring about interest rates and just goes higher.
Pullbacks get shallow. Confidence in debt starts cracking.
Above $5,600 — Money Printing Is Being Priced
This is where gold stops acting like a commodity and starts acting like backup money.
It usually means:
-
Governments are openly supporting bond markets
-
Yields are capped one way or another
-
Currency credibility is questioned
Gold gets volatile, but it doesn’t fall much.
This is not panic — it’s repricing trust.
Simple Weekly Checklist (No Jargon)
Watch these instead of headlines:
-
Are real interest rates staying high or failing to stay high?
-
Are bond auctions getting weaker?
-
Are central banks expanding balance sheets again?
-
Are governments borrowing more every year?
-
Are dips in gold still being bought?
Bottom Line
Gold isn’t rising because of wars, elections, or scary news.
It’s rising because governments are stuck with too much debt and too little room to fix it. As long as sell-offs stop at higher levels and policy avoids real discipline, gold stays structurally supported. Big drops only make sense if governments prove they can live within their means — and so far, they haven’t.
The Five Rules for Trading XAUUSD (Macro-Driven Cycle)
Rule 1: Respect the Line in the Sand
$4,450–$4,600 is the most important zone.
-
As long as gold holds above this area, the long-term trend is intact.
-
Every sharp drop into this zone that does not cascade is a buy signal, not a warning.
-
A brief spike below doesn’t matter.
Sustained acceptance below $4,300 does.
👉 If this level keeps holding, the market is telling you big money is still in.
Rule 2: Sell Volatility, Not Direction
Gold in this cycle corrects sideways or in time, not in price.
-
Expect chop, fake breakdowns, and frustrating ranges.
-
Do not treat $100–$200 pullbacks as trend reversals.
-
The more “overvalued” gold sounds in the media while price refuses to break, the stronger the structure usually is.
👉 If price is boring and noisy, the trend is probably healthy.
Rule 3: Watch Rates — But Only When They Stick
Real rates only matter if they stay high.
-
Rising real yields for a few weeks = noise.
-
Real yields holding above +1.75–2.0% for months = real threat.
-
If rates rise and gold doesn’t break support, gold is winning the argument.
👉 Temporary rate spikes don’t kill this trade. Persistence does.
Rule 4: Above $5,300, Think Defense, Not Shorts
Once gold holds above $5,300, behavior changes.
-
Pullbacks get shallow.
-
Momentum and long-term buyers align.
-
Shorting becomes asymmetric and dangerous.
👉 Above this zone, you manage longs — you don’t try to be clever.
Rule 5: Only One Thing Truly Breaks the Trend
Gold only fails if governments regain discipline.
That means:
-
Deficits fall meaningfully and legally
-
Real rates stay positive without crashing markets
-
Central banks stop buying gold
Until that happens, assume:
-
Dips are corrective
-
Volatility is noise
-
Upside risk is larger than downside risk
👉 Price is reacting to policy limits, not headlines.
One-Sentence Summary
Gold is in trouble only if discipline returns; until then, weakness is a feature, not a bug.
————————————————————————————
XAUUSD — Murray Math Levels & Market Meaning
| Murray Level | Price Zone (Approx) | Technical Meaning | Market Behavior / Interpretation |
|---|---|---|---|
| +2/8 | 5,700 – 5,900 | Extreme Overshoot | Rare blow-off territory. Only reachable under explicit monetary repression / YCC / panic hedging. Volatility very high. Not sustainable without policy stress. |
| +1/8 | 5,450 – 5,600 | Overbought Expansion | Final extension zone in strong trends. Price accelerates, pullbacks shallow. Shorts extremely risky. Momentum dominates fundamentals. |
| 8/8 | 5,200 – 5,300 | Ultimate Resistance | Major psychological & technical ceiling. Acceptance above this confirms regime change rather than overvaluation. |
| 7/8 | 5,050 – 5,200 | Strong Resistance | Late-cycle resistance where consolidation is common. Breaks here require macro confirmation (rates stress, auctions, FX vol). |
| 6/8 | 4,900 – 5,050 | Pivot / Trend Control | Market decides direction here. Holding above = bullish continuation. Rejection = range trading. |
| 5/8 | 4,750 – 4,900 | Major Trading Range | Heavy two-way flow. Best zone for mean-reversion trades during consolidation phases. |
| 4/8 | 4,600 – 4,750 | Key Structural Support | Most important support in the cycle. Repeated defense confirms long-term allocation demand. |
| 3/8 | 4,450 – 4,600 | Range Floor / Buy Zone | Ideal dip-buying area in strong trends. Failure here changes medium-term structure. |
| 2/8 | 4,250 – 4,450 | Weak Support | If price enters this zone, macro credibility is being tested. Needs fast reclaim to stay bullish. |
| 1/8 | 4,050 – 4,250 | Extreme Weakness | Market signaling policy improvement or real-rate dominance. Not compatible with bullish macro thesis unless reclaimed quickly. |
| 0/8 | 3,800 – 4,050 | Structural Floor | Long-term equilibrium under disciplined policy. Sustained trade below = macro thesis failure. |
How to Use This Table (Practically)
-
Above 4/8 (4,600):
Trend-following bias. Buy pullbacks, avoid shorts. -
Between 5/8–6/8:
Expect chop. Trade ranges, not breakouts unless macro confirms. -
Above 7/8:
Momentum regime. Reduce leverage, widen stops, respect volatility. -
Below 3/8:
Demand macro confirmation before staying bullish.
Murray Math + Macro Alignment (Quick Read)
-
4/8–5/8: Structural accumulation
-
6/8: Decision zone
-
7/8–8/8: Fiscal stress recognition
-
+1/8 / +2/8: Monetary repression pricing
Final Technical Take
As long as XAUUSD holds above the 4/8–3/8 band, Murray Math confirms a healthy, sponsored trend.
Rejection only becomes meaningful below 3/8 with follow-through, not on volatility spikes.
XAUUSD — Murray Math Aligned Execution Table
| Murray Level | Price Zone | Market Regime | What You Do | What Confirms It | What Invalidates It |
|---|---|---|---|---|---|
| +2/8 | 5,700–5,900 | Blow-off / Repression | Scale out longs only. No fresh buys. Never short aggressively. | YCC / QE / failed auctions / FX stress | Sudden policy discipline, rate spike |
| +1/8 | 5,450–5,600 | Momentum Extension | Trail stops on longs. Add only on shallow pullbacks. | Gold decouples from real rates | Daily close back below 8/8 |
| 8/8 | 5,200–5,300 | Regime Test | Break-and-hold = buy. Rejection = range trade | Auction stress, policy rhetoric | Multiple failed weekly closes |
| 7/8 | 5,050–5,200 | Late Resistance | Partial profit-taking. Tighten risk. | Macro stress building | Strong rejection + real rates up |
| 6/8 | 4,900–5,050 | Trend Control | Directional bias decided here | Holding above = bullish | Acceptance below shifts to range |
| 5/8 | 4,750–4,900 | Range Magnet | Mean-reversion trades only | Stable macro, no shock | Strong impulsive breakout |
| 4/8 | 4,600–4,750 | Structural Support | Primary dip-buy zone | CB buying, deficits persist | Weekly close below 3/8 |
| 3/8 | 4,450–4,600 | Allocation Floor | Highest-confidence buy zone | Selling absorbed quickly | Acceptance below 2/8 |
| 2/8 | 4,250–4,450 | Structural Warning | Reduce size. Wait for reclaim | Macro improving | Failure to reclaim 3/8 |
| 1/8 | 4,050–4,250 | Weak Regime | No longs unless fast reclaim | Real yields rising | Continued acceptance |
| 0/8 | 3,800–4,050 | Thesis Failure | Flat or short rallies | Fiscal discipline | Only rebounds, no reclaim |
 How Professionals Actually Trade This
Bullish Operating Rules
-
Above 4/8:
➜ Trade with trend
➜ Buy pullbacks, not breakouts -
Above 6/8:
➜ Momentum acceptable
➜ Reduce leverage, widen stops -
Above 8/8:
➜ Structural shift confirmed
➜ Shorts become asymmetric
Neutral / Range Rules
-
5/8–6/8:
➜ Sell highs, buy lows
➜ Do not chase direction
➜ Wait for macro confirmation
Bearish / Risk-Off Rules
-
Below 3/8:
➜ Demand macro proof
➜ Technical breaks alone are not enough -
Below 0/8:
➜ Only valid if policy discipline confirms
➜ Otherwise treat as false breakdown
Macro Overlay (Simple)
| Price Behavior | Macro Reality |
|---|---|
| Dips bought at 3/8–4/8 | Allocation sponsorship |
| Chop above 5/8 | Fiscal stress managed |
| Acceptance above 8/8 | Repression being priced |
| Sustained below 0/8 | Discipline restored |
One-Line Trading Logic
If price respects Murray support, trust structure.
If price breaks Murray support, demand macro confirmation.
That’s the edge.
————————————————————————————-
XAUUSD Trading Playbook (Horizon-Specific)
| Horizon | Key Murray Zones | Strategy | Entry | Exit / Stops | Macro Confirmation |
|---|---|---|---|---|---|
| Intraday (1–24h) | 4,600–5,200 (4/8–6/8) | Range / Mean Reversion | Buy near 4/8, Sell near 6/8 | Tight stops (~20–40 pts) | Real-time auction results, short-term rates, USD volatility |
| 5,200–5,600 (7/8–+1/8) | Momentum Scalps | Buy on shallow pullbacks | Trailing stops, scale out at +1/8 | Central bank statements, FX spikes, auction stress | |
| <4,450 (2/8–3/8) | Caution / Reclaim | Only enter on strong reclaim signals | Stops just below recent low | Macro improving, central bank buying, fiscal deficit signals | |
| Swing (2–14 days) | 4,450–4,750 (3/8–4/8) | Dip Buying / Trend Following | Buy weekly closes near 4/8 | Stop below 4/8 | Central bank gold flows, fiscal deficit reports, real yield trend |
| 4,900–5,200 (5/8–6/8) | Trend Continuation | Buy pullback to mid-range | Stop below 5/8 | Treasury auctions, USD correlation, MOVE index | |
| 5,300–5,600 (7/8–+1/8) | Momentum Extension | Add to long positions cautiously | Scale out in increments | YCC/QE talk, failed auction stress, FX volatility | |
| Position (3–12 weeks) | 4,600–5,200 (4/8–6/8) | Core Trend Accumulation | Buy structural support (4/8–5/8) | Stop below 3/8 | Macro unchanged, deficits large, CB buying steady |
| 5,200–5,600 (7/8–+1/8) | Tactical Add-on | Gradual accumulation | Trail stop ~50–100 pts | Fiscal stress building, auctions weak | |
| 5,600+ (+2/8) | High Convexity / Repression Zone | Scale cautiously; avoid new aggressive buys | Tight trailing stop | Explicit debt monetization, FX stress, policy intervention |
Guiding Principles Across Horizons
-
Structural Support Rules
-
Zones 3/8–4/8 (4,450–4,750) are buy-on-dip zones across all horizons.
-
Price should repeatedly test but not break for trend to remain valid.
-
-
Momentum / Extension Rules
-
Above 5/8–7/8, price accelerates; pullbacks are shallow.
-
Intraday: use tight stops and scale out quickly.
-
Position: only accumulate cautiously — volatility spikes are likely.
-
-
Trend Invalidation Rules
-
Weekly close below 3/8 (~4,450) → macro confirmation needed to remain bullish.
-
Sustained break below 0/8 (~3,800) → trend invalidated unless fiscal policy proves disciplined.
-
-
Macro Alignment
-
Always overlay: deficits, real rates, treasury auctions, central bank buying, USD strength/weakness.
-
If macro contradicts price, bias moves neutral or defensive.
-
-
Risk Management
-
Intraday: 0.5–1% risk per trade
-
Swing: 1–2% risk per position
-
Position: 2–3% risk per allocation, scale in/out progressively
-
Quick Reference for Traders
| Price Action | Recommended Behavior |
|---|---|
| Dips into 3/8–4/8 | Buy support; trend intact |
| Ranges in 5/8–6/8 | Mean-reversion or trend continuation |
| Breaks above 7/8 | Momentum add-on; shallow pullbacks only |
| Below 3/8 | Demand macro confirmation; risk off |
| Sustained <0/8 | Trend invalidated; avoid longs |

![]()