
XAGUSD – Macro Cycle Timing Overlay
(Integrating monetary cycle, liquidity regime, growth cycle & ratio dynamics)
To properly frame Silver here, we overlay four macro cycles that typically govern major inflection points in precious metals:
-
Monetary Policy Cycle
-
Real Yield Cycle
-
Dollar Liquidity Cycle
-
Global Industrial Cycle
Silver only trends aggressively when at least two of the four align.
1️⃣ Where We Likely Are in the Macro Cycle
A) Monetary Policy Cycle – Late Tightening → Early Easing Transition
Historically, Silver performs strongest:
-
After the final rate hike
-
During the first 6–12 months of easing
-
When markets front-run liquidity expansion
If central banks are near peak rates or already pivoting:
→ This is typically Phase 2 of the Precious Metals Cycle
Phases historically look like:
| Phase | Macro Condition | Silver Behavior |
|---|---|---|
| Phase 1 | Aggressive tightening | Underperforms Gold |
| Phase 2 | Policy pause / pivot expectations | Base formation |
| Phase 3 | Early easing + falling real yields | Strong outperformance |
| Phase 4 | Late-cycle reflation | Blow-off / parabolic move |
Your chart suggests we may be transitioning between Phase 2 and early Phase 3.
2️⃣ Real Yield Cycle (Critical for Timing)
Silver’s major expansions coincide with:
-
Falling US 10Y real yields
-
Inflation expectations stabilizing
-
Financial conditions easing
If real yields roll over decisively:
→ That historically marks the acceleration window for Silver.
In prior cycles:
-
2009–2011
-
2020–2021
Silver lagged Gold initially, then violently outperformed once liquidity expanded.
We may be in that lag-to-lead rotation window now.
3️⃣ Dollar Liquidity Cycle
Silver is highly sensitive to global USD liquidity.
Major Silver bull legs align with:
-
Structural USD downtrend
-
Expanding global money supply
-
Capital rotation into commodities
If the Dollar Index enters cyclical decline:
→ Gold leads
→ Silver follows
→ Then Silver outperforms late-cycle
At a 60x Gold/Silver ratio, we are mid-rotation — not early undervaluation, not late blow-off.
4️⃣ Global Industrial Cycle Overlay
This is where Silver differs from Gold.
Silver requires:
-
Stabilizing China PMI
-
Manufacturing rebound
-
Solar/EV capex acceleration
If global growth bottoms and re-accelerates:
→ Silver gains dual tailwinds (monetary + industrial)
If recession deepens:
→ Silver initially underperforms Gold.
Right now, macro signals appear mixed — meaning volatility expansion is likely before trend clarity.
5️⃣ Gold/Silver Ratio Timing Model
Ratio extremes often mark cycle transitions:
| Ratio Level | Macro Regime |
|---|---|
| >90x | Crisis / liquidity stress |
| 70–80x | Defensive positioning |
| 50–60x | Reflation normalization |
| <45x | Late-cycle commodity boom |
We moved from 100x → 60x:
That is a normalization move, not a terminal Silver mania.
Historically:
-
The explosive Silver runs begin once ratio breaks below ~55x decisively.
-
If ratio re-expands above 70x → defensive regime returning.
We are in the middle transition band.
6️⃣ Timing Windows (Forward-Looking)
High Probability Acceleration Window:
Next 6–12 months IF:
-
Real yields fall
-
Fed/ECB pivot confirmed
-
USD weakens structurally
-
China stimulus gains traction
Delay / Risk Scenario:
-
Sticky inflation → higher-for-longer real rates
-
USD squeezes higher
-
Industrial slowdown deepens
Then Silver likely revisits macro supports before expansion.
7️⃣ Cycle Composite Probability
Based on macro overlay:
-
40%: Controlled reflation → Silver trends higher toward 110+
-
35%: Extended range 60–90 while macro clarity develops
-
25%: Risk-off USD spike → Silver back to 60 support
The explosive 140+ scenario likely requires:
-
Full easing cycle
-
Liquidity expansion
-
Commodity supercycle narrative
Not yet confirmed.
8️⃣ Strategic Hedge Fund Positioning View
If running macro capital:
Base Case:
Gradual accumulation on weakness while hedging USD exposure.
Tactical Play:
Wait for:
-
Decisive break of 91
-
Ratio <55
-
Real yields breakdown
That alignment historically produces convex upside.
Final Macro Conclusion
Silver appears to be in a transition regime, not a climax regime.
The structural bull case remains viable,
but timing the expansion phase requires confirmation from:
-
Real yield rollover
-
Dollar downtrend
-
Industrial stabilization
Until then:
Expect volatility compression → followed by expansion.
XAGUSD – 12-Month Macro Scenario Model
(Cycle timing, liquidity regime & positioning overlay)
This is structured the way a macro hedge fund would map forward outcomes — not as prediction, but as probability-weighted scenario construction.
We build three primary regimes:
-
Reflation Expansion (Bull Case)
-
Range / Transition Regime (Base Case)
-
Risk-Off Liquidity Shock (Bear Case)
Each tied to macro triggers.
🟢 SCENARIO 1 — Reflation Expansion (40% Probability)
Macro Conditions Required
-
Sustained decline in US real yields
-
Confirmed rate-cut cycle
-
Structural USD downtrend
-
Stabilization in China / global PMIs
-
Gold/Silver ratio breaks <55
Market Structure Implication
Silver transitions from Phase 2 (base) → Phase 3 acceleration.
Price Path Model
Q1–Q2:
-
Break above 91
-
Momentum expansion toward 110
Q3–Q4:
-
Extension toward 125–140 zone
-
Ratio compresses toward 45–50
Performance Profile
-
Silver outperforms Gold
-
Volatility increases
-
ETF inflows reaccelerate
-
Spec positioning rebuilds
Risk
Late-cycle overheating → sharp corrections after parabolic move.
🟡 SCENARIO 2 — Transitional Range Regime (35% Probability)
Macro Conditions
-
Sticky inflation
-
Gradual policy easing but real yields remain elevated
-
USD trades sideways
-
Global growth soft but not collapsing
Market Structure
Silver trapped between:
-
Support: 60–79
-
Resistance: 90–110
Gold/Silver ratio oscillates 55–70.
Price Path Model
Q1–Q2:
-
Failed breakouts above 91
-
Mean reversion moves
Q3–Q4:
-
Volatility compression
-
Late breakout attempt but no structural acceleration
Performance Profile
-
Short-term traders dominate
-
Low trend persistence
-
Carry strategies outperform directional bets
Risk
Crowded positioning unwind triggers sharp but temporary downside spikes.
🔴 SCENARIO 3 — Risk-Off Liquidity Shock (25% Probability)
Macro Triggers
-
USD spike
-
Financial stress event
-
Real yields reprice higher
-
Hard global growth slowdown
Market Structure Shift
Silver underperforms Gold (beta downside).
Gold/Silver ratio expands back above 70.
Price Path Model
Q1–Q2:
-
Breakdown below 79
-
Test 60
Q3–Q4:
-
Possible overshoot toward 40–50 zone
-
Eventual stabilization as central banks respond
Performance Profile
-
Gold outperforms
-
Silver highly volatile
-
Industrial demand contracts
Opportunity
Deep macro accumulation zone for next multi-year leg.
🔎 Timing Windows Over Next 12 Months
| Quarter | Key Macro Catalysts | Silver Sensitivity |
|---|---|---|
| Q1 | Inflation data + policy guidance | High volatility |
| Q2 | First confirmed easing signals | Breakout potential |
| Q3 | Liquidity transmission phase | Acceleration window |
| Q4 | Cycle maturity | Blow-off or exhaustion |
Silver historically accelerates 6–9 months after first rate cut.
📊 Scenario Return Expectations (Rough Framework)
| Scenario | 12M Range Projection | Return Profile |
|---|---|---|
| Bull | 110–140 | +25% to +60% |
| Base | 65–105 | -10% to +20% |
| Bear | 40–65 | -20% to -45% |
Distribution skew is positive if policy easing confirms.
🧠 Positioning Strategy by Regime
If Reflation Confirmed:
-
Increase beta exposure
-
Rotate from Gold → Silver overweight
-
Use pullbacks to add
If Range Persists:
-
Sell volatility extremes
-
Trade mean reversion levels
If Liquidity Shock:
-
Reduce leverage
-
Hedge with USD exposure
-
Accumulate near structural supports
🎯 Most Important Leading Indicators to Monitor
-
US 10Y real yield trend
-
Dollar Index structural direction
-
China PMI / credit impulse
-
Gold/Silver ratio level (55 break is key)
-
ETF flow momentum
When 3+ align bullish, probability shifts aggressively toward Scenario 1.
Bottom Line
Silver is not at a macro climax.
It is in a transition regime with asymmetric upside IF liquidity expands.
The next 3–6 months will likely determine which 12-month path dominates.
======================================================
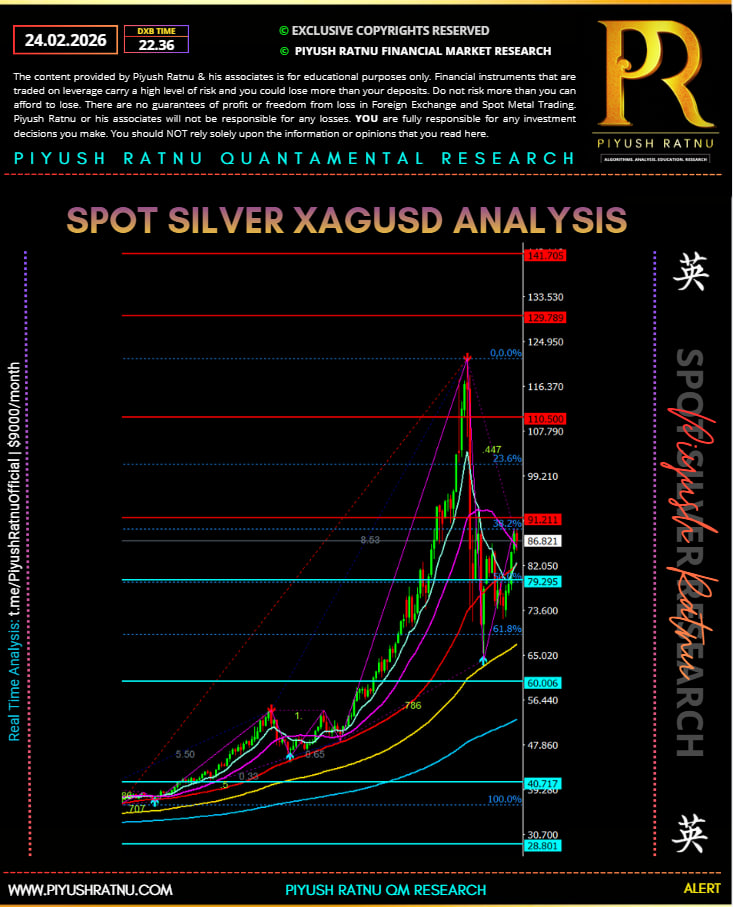
XAGUSD – Murray Math Quantified Trade Framework
(Monthly Structure – Institutional Execution Model)
Murray Math works on price fractals divided into 8/8ths (octaves).
Key levels behave statistically as:
-
0/8 & 8/8 → Extreme reversal zones
-
2/8 & 6/8 → Pivot reversal levels
-
4/8 → Major balance point
-
+1/8 & -1/8 → Breakout acceleration zones
🔢 Current Key Murray Levels
Approximate structural levels visible:
| Murray Level | Price Zone | Meaning |
|---|---|---|
| 8/8 | ~124–125 | Extreme resistance |
| 7/8 | ~110.5 | Major supply |
| 6/8 | ~91.2 | Pivot resistance |
| 5/8 | ~79.3 | Equilibrium pivot |
| 4/8 | ~60.0 | Major structural balance |
| 3/8 | ~40.7 | Deep support |
| 2/8 | ~28.8 | Extreme support |
Price currently rotating between 5/8 (79) and 6/8 (91).
This is a classic Murray compression box.
📊 Quantified Trade Setups
We structure entries based on statistical Murray behavior.
🟢 Setup 1 – 5/8 Reversal Long (High Probability)
Zone: 79–82
Level: 5/8 Octave
Statistical Edge:
-
5/8 often acts as strong reversion point in trending markets.
-
In bull macro regimes, 5/8 tends to hold.
Entry Rule:
-
Weekly close above 5/8 after rejection wick
-
OR bullish engulfing near 79
Stop:
-
Below 73 (1 ATR monthly buffer)
Targets:
-
6/8 → 91
-
7/8 → 110
Risk/Reward:
1:3 minimum
This is the structural continuation entry.
🟢 Setup 2 – 4/8 Deep Accumulation Long
Zone: 60–65
Level: 4/8 (Major Balance Line)
Statistical Behavior:
4/8 is strongest support in Murray structure.
When price retraces here in macro bull cycles → high convexity opportunity.
Entry Rule:
-
Monthly rejection
-
Momentum divergence
-
Volume spike
Stop:
-
Below 55 monthly close
Targets:
-
5/8 (79)
-
6/8 (91)
-
7/8 (110)
This is the asymmetric capital deployment zone.
🔴 Setup 3 – 6/8 Failure Short
Zone: 91–93
Level: 6/8
Statistical Behavior:
6/8 acts as strong pivot reversal if trend weakens.
Failure here often sends price back to 4/8.
Entry Rule:
-
Weekly rejection candle
-
Bearish divergence
-
Failure to hold above 6/8 for 2 weekly closes
Stop:
-
Above 96
Targets:
-
5/8 → 79
-
4/8 → 60
This is a mean reversion short, not macro short.
🔥 Setup 4 – 6/8 Breakout Expansion Long
If:
-
Weekly close above 91
-
Follow-through above 93
-
Gold/Silver ratio <55
Then probability shifts to octave expansion.
Entry:
-
Break & retest of 91
Targets:
-
7/8 → 110
-
8/8 → 124
-
+1/8 → 141
This is the trend acceleration trade.
⚠️ Setup 5 – 5/8 Breakdown (Regime Shift)
If:
-
Weekly close below 79
-
No immediate reclaim
Then 4/8 magnet activates.
Short Entry:
-
Retest of 79 from below
Targets:
-
60
-
40
This scenario aligns with USD spike / real yield surge.
📈 Quantified Probability Matrix (Current Structure)
Given compression between 5/8 and 6/8:
| Outcome | Probability |
|---|---|
| Range 79–91 continues | 45% |
| Break above 91 → 110 | 30% |
| Breakdown → 60 | 25% |
Volatility contraction suggests expansion within next 2–4 monthly candles.
🧠 Professional Execution Strategy
If running capital:
-
30% size near 79
-
30% add above 91
-
40% deploy only if 60 prints
Never full-size inside compression.
📌 Trigger Dashboard
Bullish Alignment Requires:
-
Real yields falling
-
USD weakening
-
Ratio <55
-
Weekly close above 91
Bearish Alignment Requires:
-
USD breakout
-
Ratio >70
-
Weekly close below 79
Final Institutional View
Murray structure shows we are sitting at the equilibrium pivot (5/8).
This is decision territory — not chase territory.
The next confirmed break of:
-
91 → expansion leg
-
79 → deep retracement
Will likely define the next 6–9 months.