How to trade XAUUSD Spot Gold for next 72 hours after NonFarm Payrolls on the basis of Weekly Price Projections by Piyush Ratnu Gold Market Research
Overall Structure
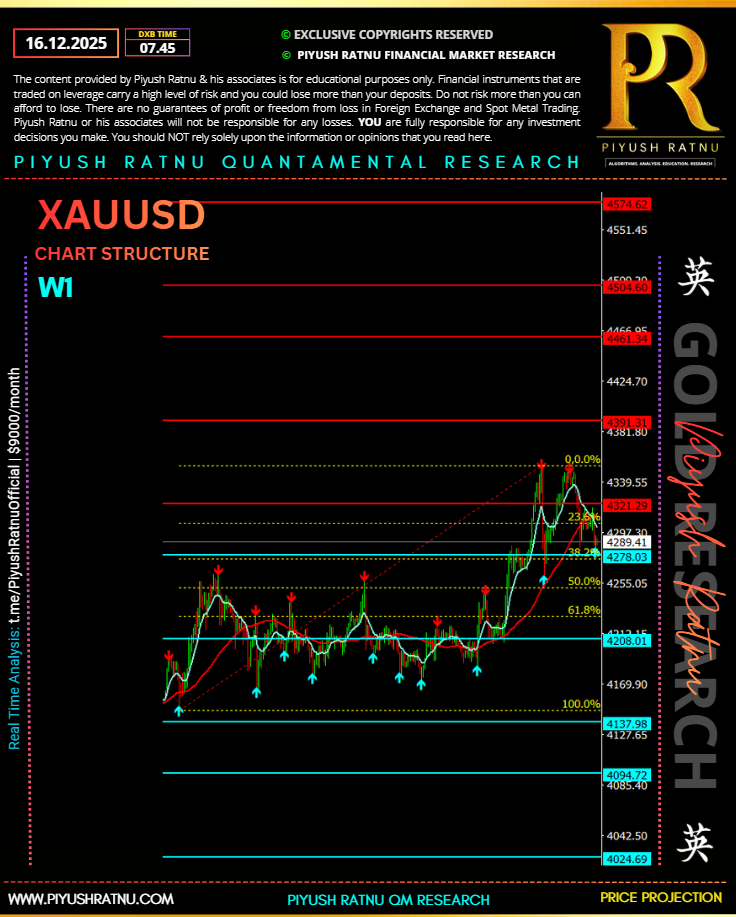
- Primary trend: Bullish, but currently in a pullback / consolidation after a sharp impulsive move up.
- Price recently made a strong rally from ~4208 → ~4346, then retraced.
- Market is now reacting at key Fibonacci retracement levels, suggesting a decision zone.
Key Levels (Very Important)
Resistance
- 4346–4350 → Recent swing high / 0% Fib (major rejection zone)
- 4391 → Upper resistance
- 4461 / 4504 / 4574 → Higher timeframe resistance targets if breakout occurs
Support
- 4321 → Near-term resistance-turned-support (currently being tested)
- 4278 → 38.2% Fib (critical bullish support)
- 4255 → 50% Fib (major pivot)
- 4208 → 61.8% Fib + previous base (trend-defining support)
- 4138–4095 → Deep support / trend failure zone
Fibonacci Interpretation
- Price pulled back from 0% → between 23.6% and 38.2%
- This is a healthy retracement in a strong trend
- As long as 4278–4255 holds, bulls remain in control
- A break below 4208 (61.8%) would weaken the bullish structure significantly
Moving Averages
- Fast MA (green) is still above slow MA (red) → bullish alignment
- Price is pulling back toward the MAs, not breaking them aggressively
- This suggests trend continuation, not reversal (yet)
Momentum & Price Action
- Sharp impulsive move up → indicates strong buying interest
- Current candles show profit-taking, not panic selling
- No clear lower low formed yet → trend intact
- Rejection wicks near the highs show sellers defending 4346
Bullish Scenario
- Hold above 4278–4255
- Bounce and reclaim 4321
- Break and close above 4346
- Targets:
- 4391
- 4461
- 4504+
Bearish Scenario
- Lose 4255 (50% Fib)
- Increased selling toward 4208
- Daily close below 4208:
- Bull trend compromised
- Likely move toward 4138–4095
Conclusion
- Bias: Bullish-to-neutral
- Market is in a normal retracement within an uptrend
- 4278–4255 is the line in the sand
- Above it → buy-the-dip structure
- Below 4208 → trend reversal risk increases
Smart Money / Liquidity Analysis
Below is a Smart Money / Liquidity Analysis, using buy-side & sell-side liquidity, inducement, and institutional reaction zones.
- Buy-Side Liquidity (Where Smart Money Sells into Strength)
Major Buy-Side Liquidity Pools (Above Price)
These are areas where retail breakout buyers place stops above highs, and institutions distribute:
- 4346–4350 (Highest Priority)
- Equal highs / recent swing high
- Tagged already → classic buy-side liquidity sweep
- Sharp rejection confirms smart money selling into liquidity
📌 This was NOT a breakout — it was a liquidity grab.
- 4391
- Next clean high above current structure
- Untapped buy-side liquidity
- Likely target if price re-accumulates and pushes higher
- 4461 → 4504 → 4574
- Higher-timeframe liquidity pools
- These are distribution targets, not random resistance
- Price only reaches these if institutions reload longs below
- Sell-Side Liquidity (Where Smart Money Buys)
Major Sell-Side Liquidity Pools (Below Price)
- 4278–4255 (Prime Smart Money Buy Zone)
- 38.2% – 50% Fibonacci
- Previous breakout structure
- Cluster of equal lows & stop placements
- Liquidity resting below weak hands’ stops
📌 This is a textbook “sell-side liquidity raid → bullish continuation” zone.
- 4208 (Institutional Reload Zone)
- 61.8% Fib
- Previous accumulation base
- Clear swing low = heavy retail stop concentration
📌 If price sweeps below 4208 and quickly reclaims, that is strong smart-money confirmation.
- 4138–4095
- Deep sell-side liquidity
- Trend invalidation zone
- If price trades here → market structure likely shifts bearish
- Inducement Zones (Where Retail Is Trapped)
Inducement Above 4321
- Price reclaimed 4321 → attracted breakout longs
- Then failed to hold 4346
- Result: bull trap / inducement
Smart money:
- Lured buyers above 4321
- Swept buy-side at 4346
- Now targeting sell-side below
- Smart Money Flow (What Institutions Are Likely Doing)
Current Phase
- Distribution at highs
- Targeting sell-side liquidity below
- Not bearish yet — re-accumulation behavior
- High-Probability Liquidity Path
Most likely sequence:
- ✔ Buy-side sweep at 4346 (done)
- ⬇ Move into 4278–4255 sell-side
- ✔ Stops flushed
- ⬆ Strong displacement upward
- 🎯 Targets:
- 4391
- 4461+
- Confirmation Signals to Watch
Smart money confirmation if you see:
- Long lower wicks in 4255–4278
- Strong bullish candle closing back above 4321
- Volume spike on down-move, lower volume on pullback
- Break in micro structure after liquidity sweep
- Summary
- Buy-side liquidity taken ✔
- Sell-side liquidity pending ⏳
- Bias: Smart-money bullish after liquidity grab
- Key buy zone: 4255–4278
- Invalidation: Sustained acceptance below 4208
- ICT DEALING RANGE (PD ARRAY FRAMEWORK)
Define the Range
Using your chart:
- Range High (RH): 4346–4350
- Range Low (RL): 4208
- Dealing Range: ~138 pts
This gives us the institutional operating range.
Equilibrium (50% of Dealing Range)
- Midpoint ≈ 4277–4280
📌 Very important:
Price is currently rotating above EQ but failing at premium highs → this is distribution behavior, not impulsive continuation.
Premium vs Discount
- Premium Zone (Smart Money Sells):
- 4321 → 4346
- Discount Zone (Smart Money Buys):
- 4278 → 4208
👉 ICT rule:
Institutions sell in premium, buy in discount.
Right now, price is in premium but showing weakness → expect a sell-side run.
- LIQUIDITY ENGINE (SEQUENCE MODEL)
What Has Already Happened
✔ Buy-side liquidity swept at 4346
✔ Breakout traders trapped
✔ Weak rejection, no continuation
This tells us:
The market already did its job ABOVE the range.
What Is LikELY Next
⬇ Target sell-side liquidity below EQ
Primary targets:
- 4278 (EQ + Sell-side)
- 4255 (50% Fib + Stops)
- 4208 (Major Sell-Side Pool)
- ENTRY MODELS (HIGH-PROBABILITY ONLY)
MODEL 1: Classic ICT OTE Long (Most Probable)
Location
- 4255–4278 (OTE zone)
- Inside discount
- After sell-side sweep
Confirmation (Must Have)
One of the following on lower TF:
- Market Structure Shift (MSS)
- Displacement candle
- Bullish FVG formed after sweep
Execution
- Entry: On FVG tap / breaker
- Stop: Below 4208
- Targets:
- 4321
- 4346
- 4391+
📌 This is a re-accumulation long, not blind dip buying.
MODEL 2: Sell-Side Sweep → Immediate Reversal (Power Move)
What You Want to See
- Fast sweep below 4208
- Immediate reclaim above 4255
- Strong bullish displacement
This is classic ICT Judas Swing behavior.
📌 If this happens → very aggressive longs allowed.
MODEL 3: Short-Term Distribution Short (Advanced)
⚠ Counter-trend, only for experienced traders
Location
- 4321–4346
- After weak high / equal highs
- Low volume push up
Confirmation
- Lower TF MSS bearish
- Failed displacement
- Bearish FVG tap
Target
- 4278
- 4255
📌 This is internal range short, not a macro bearish play.
- TRAPS IDENTIFIED (VERY IMPORTANT)
Bull Trap
- Break above 4321
- Retail longs pile in
- Buy-side swept at 4346
- No continuation
✔ Confirmed bull trap
Bear Trap (Potential, Not Confirmed Yet)
- If price sweeps 4208
- Then reclaims quickly
📌 That would be a textbook bear trap and strong long signal.
- IS THIS DISTRIBUTION BEFORE A DUMP?
Short Answer:
👉 Not yet — but it could become one if conditions change.
Why This Is NOT Macro Distribution (Yet)
✔ No sustained acceptance below 4208
✔ No lower low on higher TF
✔ Strong impulsive bullish leg prior
✔ Pullback is proportional (not aggressive)
This looks like range rebalancing, not unloading.
What WOULD Confirm Distribution → Dump
🚨 Watch for ALL of these:
- Daily close below 4208
- Failed reclaim of EQ (4278)
- Weak bounce with bearish displacement
- EQ flips to resistance
If that happens → targets become:
- 4138
- 4095
- 4024
That would be true distribution.
- SMART MONEY NARRATIVE (CLEAN VERSION)
Institutions ran buy-side liquidity above 4346, trapped breakout traders, and are now engineering a move into discount to reload longs.
Unless 4208 fails decisively, this is accumulation after inducement, not a top.
- HIGH-PROBABILITY PLAYBOOK
Best Play:
- Wait for sell-side run into 4255–4208
- Enter only after confirmation
- Target range highs & higher liquidity
Worst Play:
- Chasing longs above 4321
- Shorting blindly without sell-side taken
- SMT DIVERGENCE (SMART MONEY TELL)
What to Compare
Use correlated markets:
- ES ↔ NQ
- ES ↔ YM
- ES ↔ SPX cash
Bearish SMT (Already Showing / Watch Carefully)
Context: At highs (premium)
Criteria
- ES makes a higher high near 4346
- NQ or YM fails to make a higher high
- Momentum divergence on correlated index
📌 Meaning:
Smart money is distributing, not accumulating at highs.
➡ This supports the idea that buy-side liquidity was the objective, not continuation.
Bullish SMT (What You Want for Longs)
Context: At discount (4255–4208)
Criteria
- ES sweeps sell-side liquidity
- ES makes a lower low
- NQ/YM does NOT confirm (higher low)
📌 Meaning:
Smart money is absorbing sell pressure → high-confidence reversal.
⚠ No SMT = no trade (for high-probability setups)
- FAIR VALUE GAPS (FVG) – WHERE ALGORITHMS EXECUTE
Bearish FVGs (Premium)
Created during the rejection from 4346
Zone
- Roughly 4325–4340
- Thin, inefficient price action
- Price respected this area on pullbacks
📌 This is where smart money sold into strength.
Bullish FVGs (Discount – Most Important)
Created during the impulsive rally from 4208 → 4346
Key Bullish FVGs
- 4270–4285 (overlaps EQ)
- 4245–4260 (OTE overlap)
- Possible new FVG forms after sell-side sweep
📌 Best trades come from FVGs inside discount after liquidity is taken.
- BREAKER BLOCKS (INSTITUTIONAL SUPPORT)
Bullish Breaker (Primary Long Entry)
Former resistance → support after structure shift.
Location
- 4255–4278
- Previous consolidation highs
- Breakout → retrace → hold
📌 If price:
- Sweeps sell-side
- Breaks structure bullish
- Retraces into breaker
→ This is A+ ICT long model
Bearish Breaker (Intraday Short)
Former support → resistance
Location
- 4321
- Failed reclaim = bearish continuation to EQ
📌 Useful only for internal range shorts, not macro bias.
- KILLZONE TIMING (THIS IS CRITICAL)
🔥 LONDON KILLZONE (2:00–5:00 AM NY)
- Often sets false direction
- Creates equal highs/lows
- Ideal for inducement
📌 If sell-side is taken here → expect NY reversal.
🔥 NEW YORK AM KILLZONE (9:30–11:00 AM NY)
Highest probability window
Ideal Long Scenario
- Sell-side sweep happens before or just after open
- SMT divergence present
- Displacement candle in NY session
- FVG forms → retrace → entry
📌 This is where real money moves.
⚠️ LUNCH (11:30–1:30)
- Avoid new trades
- Often consolidation / stop hunts
🔥 NEW YORK PM (2:00–3:30)
- Continuation or distribution
- Targets highs/lows formed earlier
- FULL EXECUTION PLAYBOOK (STEP-BY-STEP)
Bias
- HTF bullish
- Expect sell-side run → re-accumulation
Sequence
- Price sweeps sell-side (4255 or 4208)
- Bullish SMT divergence vs NQ/YM
- Market Structure Shift on 5m/15m
- Bullish displacement candle
- FVG or breaker retrace
- Entry
- Target buy-side liquidity
Stops & Targets
- Stop: Below liquidity sweep low
- TP1: EQ (4278)
- TP2: 4321
- TP3: 4346+
- R:R often 5R–10R
- WHEN TO STAND DOWN (VERY IMPORTANT)
❌ No SMT
❌ No displacement
❌ No structure shift
❌ Move happens outside killzones
👉 That’s retail noise, not smart money.
- FINAL VERDICT
- This is NOT random volatility
- This is algorithmic liquidity engineering
- The market has:
✔ Taken buy-side
⏳ Targeting sell-side
🎯 Preparing for next expansion
Perfect. This is the discipline layer most traders skip. I’ll do this in two parts:
- WHAT NOT TO TRADE (capital preservation)
- FULL NY SESSION TRADE SIMULATION (A+ model only)
PART 1 — WHAT NOT TO TRADE (THIS SAVES YOU MONEY)
❌ 1. Do NOT Trade Without Liquidity Being Taken
If no buy-side or sell-side sweep, there is no smart money reason for price to reverse.
Examples to avoid:
- Entering longs because “it’s at support”
- Shorting because “RSI is overbought”
- Middle-of-range entries
📌 ICT rule:
Liquidity must be raided first.
❌ 2. Do NOT Trade Outside Killzones
If it’s not London or NY AM, probabilities collapse.
Specifically avoid:
- Asia session breakouts
- NY lunch chop
- Late NY PM unless continuation is clear
📌 Most losses happen outside killzones.
❌ 3. Do NOT Trade FVGs Without Displacement
A random imbalance is not an ICT setup.
Avoid:
- Small FVGs formed in consolidation
- FVGs without structure shift
- FVGs against HTF bias
📌 Displacement = intent
No displacement = noise
❌ 4. Do NOT Trade SMT Alone
SMT is confirmation, not a trigger.
Avoid:
- “NQ diverged so I entered”
- SMT without liquidity sweep
- SMT outside premium/discount
📌 SMT only matters after liquidity is taken.
❌ 5. Do NOT Chase Breakouts in Premium
This is the #1 retail mistake.
Avoid:
- Buying above 4321
- Buying after buy-side sweep
- Buying strong green candles into highs
📌 Breakouts in premium = exit liquidity
❌ 6. Do NOT Revenge Trade After Missing the Move
Smart money gives one clean entry.
Avoid:
- Late FVG taps
- 3rd or 4th retests
- Entering after expansion already happened
📌 If you miss it, wait for tomorrow.
PART 2 — FULL NY SESSION TRADE SIMULATION (ICT A+)
Context (Before NY Open)
- Prior day high swept at 4346
- Market in premium
- Expectation: sell-side raid
- Bias: bullish HTF, bearish short-term
8:30–9:15 AM NY (Pre-Market)
- Price drifts lower
- Forms equal lows around 4278
- Retail shorts enter early
📌 No trade yet (liquidity not taken)
9:30 AM NY OPEN
🔔 Volatility spike
What Happens
- Price flushes below 4255
- Sweeps sell-side liquidity
- Low prints near 4235
📌 This is the Judas Swing
9:35–9:45 AM (CONFIRMATION PHASE)
Smart Money Clues
✔ ES makes lower low
✔ NQ does NOT make lower low → Bullish SMT
✔ 5m candle closes strong bullish (displacement)
✔ Bearish structure broken
📌 Now you’re interested.
9:45–10:00 AM (ENTRY MODEL)
Formation
- Bullish FVG forms: 4245–4260
- Price retraces into FVG
- This FVG overlaps:
- Discount
- OTE
- Breaker block
🎯 LONG ENTRY
- Entry: ~4255
- Stop: 4230
- Risk: ~25 pts
10:00–10:45 AM (EXPANSION)
- Price rallies impulsively
- Breaks above 4278 EQ
- Clears 4321
📌 This confirms smart money control
TAKE PROFITS
- TP1: 4278 (partial)
- TP2: 4321
- TP3: 4346
🏆 R:R ≈ 6R–8R
11:00 AM — TRADE OVER
- NY AM killzone ends
- Liquidity objective achieved
- Stand down
📌 Do NOT re-enter
WHY THIS TRADE WORKED
✔ Liquidity taken
✔ SMT divergence
✔ Killzone timing
✔ Displacement
✔ FVG + breaker confluence
✔ HTF bias respected
WHY MOST TRADERS LOSE THIS DAY
❌ Bought the breakout above 4321
❌ Shorted late into sell-side
❌ Traded lunch chop
❌ Entered without confirmation
FINAL DISCIPLINE CHECKLIST (PRINT THIS)
Before every trade:
- ☑ Liquidity taken?
- ☑ In killzone?
- ☑ Premium/discount aligned?
- ☑ SMT present?
- ☑ Displacement candle?
- ☑ FVG / breaker entry?
If any box is unchecked → no trade.
How to trade XAUUSD Spot Gold for next 48 hours after NonFarm Payrolls on the basis of Weekly Price Projections by Piyush Ratnu Gold Market Research, Dubai.
📌 ICT NY SESSION LIVE CHEAT SHEET
⏰ TIME FILTER (DO NOT BREAK)
Trade ONLY:
-
NY AM Killzone: 9:30 – 11:00 NY
❌ No Asia
❌ No NY Lunch
❌ No boredom trades
🧭 PRE-MARKET (2–5 MIN CHECK)
Before NY open, mark:
-
☐ Prior Day High (PDH)
-
☐ Prior Day Low (PDL)
-
☐ Asian High / Low
-
☐ London High / Low
-
☐ Dealing Range High & Low
-
☐ EQ (50%)
Write ONE line:
“Today price likely seeks ______ liquidity.”
If you can’t → NO TRADE DAY
💧 LIQUIDITY CHECK (NON-NEGOTIABLE)
Ask in order:
-
Was liquidity taken?
-
☐ Buy-side (above highs)
-
☐ Sell-side (below lows)
-
❌ If NO → DO NOTHING
📍 LOCATION FILTER
-
☐ Shorts ONLY in premium (above EQ)
-
☐ Longs ONLY in discount (below EQ)
❌ Middle of range = stand down
🔄 SMT CONFIRMATION
Compare ES vs NQ or YM:
For LONGS
-
☐ ES makes lower low
-
☐ NQ/YM does NOT
→ Bullish SMT
For SHORTS
-
☐ ES makes higher high
-
☐ NQ/YM does NOT
→ Bearish SMT
❌ No SMT = NO TRADE
🧱 STRUCTURE & INTENT
You MUST see:
-
☐ Market Structure Shift (MSS)
-
☐ Strong displacement candle
❌ No displacement = fake move
🎯 ENTRY MODELS (ONLY THESE)
✅ A+ LONG
-
Sell-side sweep
-
Discount
-
Bullish SMT
-
Bullish MSS
-
Displacement
-
FVG or Breaker retrace
-
Enter on 1st or 2nd tap only
✅ A+ SHORT
-
Buy-side sweep
-
Premium
-
Bearish SMT
-
Bearish MSS
-
Displacement
-
FVG or Breaker retrace
❌ Chasing = retail behavior
🛑 STOPS (ALWAYS)
-
Stop goes beyond liquidity sweep
-
Never tighten early
-
Never move to BE emotionally
🎯 TARGETS (IN ORDER)
-
TP1: EQ
-
TP2: Opposing liquidity
-
TP3: PDH / PDL
Expect 5R–10R, not scalps.
🚫 ABSOLUTE NO-TRADE LIST
❌ No liquidity taken
❌ No SMT
❌ No displacement
❌ Outside killzone
❌ Late FVG taps
❌ Second guessing bias
If one ❌ appears → skip
🧠 MENTAL RULE (MOST IMPORTANT)
One clean trade per day is enough.
Missing a trade is a win.
Forcing a trade is a loss.
🧾 POST-TRADE (30 SECONDS)
Log ONLY:
-
Liquidity taken? Y/N
-
SMT present? Y/N
-
Model used
-
R achieved
-
Rule broken?
🟨 FINAL LIVE REMINDER
If it’s not obvious, it’s not institutional.