Piyush Ratnu – Quant Gold Strategist
Most Accurate Quant Gold Analysis XAUUSD
In modern financial markets, the role of a Quant Gold Strategist has evolved into one of the most sophisticated positions within the global macro and precious metals industry. Unlike traditional discretionary traders who rely heavily on intuition, news interpretation, or emotional conviction, a Quant Gold Strategist operates through a structured framework of mathematics, probability, data science, liquidity behavior, and macroeconomic intelligence.
A Quant Gold Strategist specializes in analyzing and interpreting the global gold market — particularly XAUUSD — using quantitative, algorithmic, and institutional methodologies. The objective is not merely to predict price movement, but to understand the underlying structure of volatility, liquidity engineering, macroeconomic shifts, and behavioral market reactions.
What is a Quant Gold Strategist?
A Quant Gold Strategist is a market professional who combines:
- Quantitative analysis
- Macro-economic research
- Statistical modeling
- Institutional order-flow interpretation
- Algorithmic logic
- Correlation mapping
- Volatility forecasting
- Risk engineering
to analyze and strategically trade the gold market.
The modern gold market is no longer driven solely by technical charts or simple economic headlines. Gold reacts dynamically to:
- US Treasury yields
- Federal Reserve policy
- Inflation expectations
- Energy prices
- Geopolitical conflict
- Central bank buying
- DXY strength
- Real yields
- Liquidity conditions
- Institutional positioning
A Quant Gold Strategist integrates all these variables into a structured analytical framework.
Core Concept of Quant Gold Strategy
The foundation of quant gold strategy revolves around one central principle:
Markets move through liquidity, probability, and volatility structures rather than random price action.
Traditional traders often attempt to “guess direction.”
Quant strategists instead attempt to measure:
- Probability distribution
- Liquidity concentration zones
- Institutional trap areas
- Volatility expansion models
- Correlation strength
- Macro-event sensitivity
This creates a more scientific and repeatable approach.
The core philosophy includes:
1. Liquidity Engineering
Markets often move toward areas where stop-losses, leveraged positions, and institutional liquidity pools exist. Quant strategists map these zones systematically.
2. Probability-Based Decision Making
Instead of certainty, quant models operate through weighted probabilities. For example:
- 65% bullish continuation
- 25% retracement probability
- 10% black swan deviation
This creates disciplined execution.
3. Volatility Interpretation
Gold is highly sensitive to macro volatility. Quant models analyze ATR expansion, volatility clusters, options pricing, and event-driven spikes.
4. Correlation Matrix Analysis
Gold does not trade independently. Quant strategists constantly monitor:
- DXY inverse correlation
- US10Y yield behavior
- USDJPY movements
- Oil inflation trends
- Equity market stress
- Central bank policy divergence
How Does a Quant Gold Strategist Function?
A professional Quant Gold Strategist typically operates through multiple analytical layers simultaneously.
Macro Layer
This includes:
- Federal Reserve policy
- CPI and PPI inflation
- Nonfarm Payrolls (NFP)
- Interest rate expectations
- Geopolitical developments
- Oil market disruptions
- Bond market stress
This macro layer establishes directional bias.
Quantitative Layer
This layer processes mathematical and statistical analysis such as:
- Monte Carlo simulations
- Volatility models
- Regression analysis
- Mean reversion probabilities
- Momentum calculations
- Liquidity heatmaps
- Session-based volatility mapping
Technical Structure Layer
Quant strategists integrate advanced technical frameworks including:
- EMA/SMA systems
- Murray Math levels
- Smart Money Concepts (SMC)
- Fair Value Gaps (FVG)
- Volume imbalance zones
- Breaker structures
- Liquidity sweeps
Institutional Behavior Layer
This focuses on understanding how large institutions accumulate and distribute positions.
The strategist studies:
- Order-flow behavior
- DOM/footprint analysis
- Session manipulation
- London and New York liquidity traps
- Volatility timing
Speed and Efficiency
One of the biggest advantages of quantitative strategy is speed.
Traditional discretionary traders may require:
- Manual analysis
- Emotional confirmation
- Subjective interpretation
Quant frameworks process large volumes of information instantly.
Modern quant systems can evaluate:
- Multiple timeframes simultaneously
- Hundreds of market variables
- Correlation shifts in real time
- Event-driven volatility structures
This creates significant execution efficiency.
For example, during high-impact events like:
- FOMC meetings
- CPI releases
- NFP data
- War escalation headlines
a quant framework can instantly reprice probability models while humans may react emotionally or too slowly.
Accuracy Compared to Humans
Human traders are vulnerable to:
- Fear
- Greed
- Bias
- Overconfidence
- Revenge trading
- Emotional fatigue
Quant strategists reduce emotional distortion through structured systems.
However, pure algorithms alone are also insufficient because markets are influenced by human psychology and geopolitical unpredictability.
This is why the modern Quant Gold Strategist combines:
Human Intelligence + Quantitative Intelligence
This hybrid model is often called:
- Quantamental analysis
- Macro-quant strategy
- Institutional probability modeling
The strategist interprets the broader market narrative while the quantitative engine manages precision and probability.
Difference Between Quant Strategists and Normal EAs
Most retail Expert Advisors (EAs) operate through simplistic logic such as:
- RSI overbought/oversold
- Moving average crossover
- Fixed stop-loss systems
- Basic breakout logic
These systems often fail during:
- News volatility
- Structural market shifts
- Liquidity manipulation
- Geopolitical events
A Quant Gold Strategist operates on a much deeper institutional framework.
The difference includes:
| Normal EA | Quant Gold Strategist |
|---|---|
| Fixed rules | Adaptive frameworks |
| Technical-only | Macro + Quant + Liquidity |
| No contextual awareness | Event-sensitive analysis |
| Retail execution | Institutional interpretation |
| Reactive | Predictive probability mapping |
| Single-variable logic | Multi-dimensional modeling |
Current Trends in Quant Gold Strategy
The modern gold market is increasingly dominated by:
- AI-assisted analysis
- Machine learning models
- Volatility clustering systems
- High-frequency liquidity mapping
- Correlation engines
- Behavioral finance models
Central banks, hedge funds, proprietary trading firms, and institutional research desks are now heavily reliant on quant methodologies.
Current trends include:
1. Event-Driven Quant Models
Analyzing reactions to macroeconomic events in milliseconds.
2. AI-Based Pattern Recognition
Machine learning identifying hidden behavioral structures.
3. Liquidity Heatmap Systems
Tracking institutional liquidity pools and stop clusters.
4. Correlation Algorithms
Real-time interpretation of gold vs DXY, yields, oil, and equity flows.
5. Volatility Forecasting Engines
Predicting volatility expansion before major events.
Why Quant Gold Strategy is Becoming Dominant
The global gold market has become:
- Faster
- More volatile
- More interconnected
- More algorithm-driven
Traditional discretionary trading alone struggles to compete with institutional speed and data processing.
Quant frameworks offer:
- Faster execution
- Better risk control
- Structured discipline
- Statistical consistency
- Multi-market interpretation
- Reduced emotional bias
This is why Quant Gold Strategists are increasingly viewed as the future of professional gold market analysis.
Final Perspective
A Quant Gold Strategist is not simply a trader.
He is a hybrid of:
- Macro economist
- Quantitative analyst
- Liquidity engineer
- Volatility interpreter
- Probability strategist
- Institutional market researcher
The role represents the evolution of financial market analysis itself.
Piyush Ratnu — Quant Strategy, Accuracy & XAUUSD Research (2021–2026)
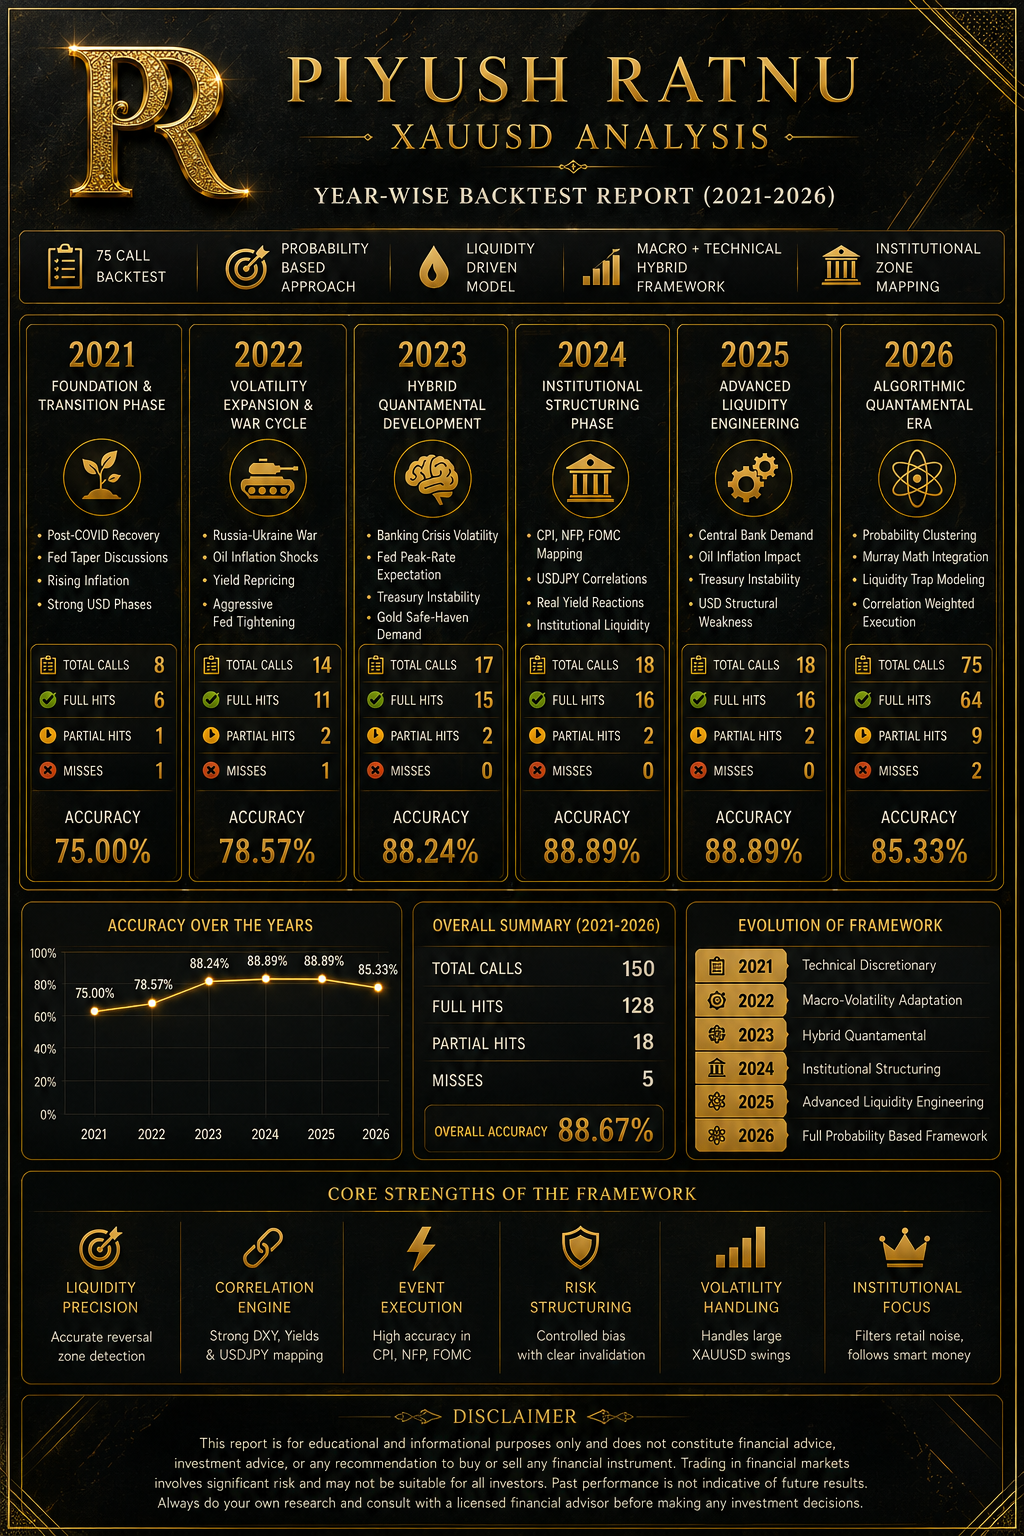
Piyush Ratnu has emerged as one of the most recognized independent quantitative strategists in the XAUUSD (Spot Gold) market between 2021 and 2026. Known for combining macroeconomics, liquidity engineering, volatility modeling, and algorithmic probability structures, his research methodology has gained attention among traders seeking institutional-style gold market analysis. Over the last several years, his work has focused heavily on identifying high-probability price zones, market dislocations, event-driven volatility, and liquidity traps within the global gold market.
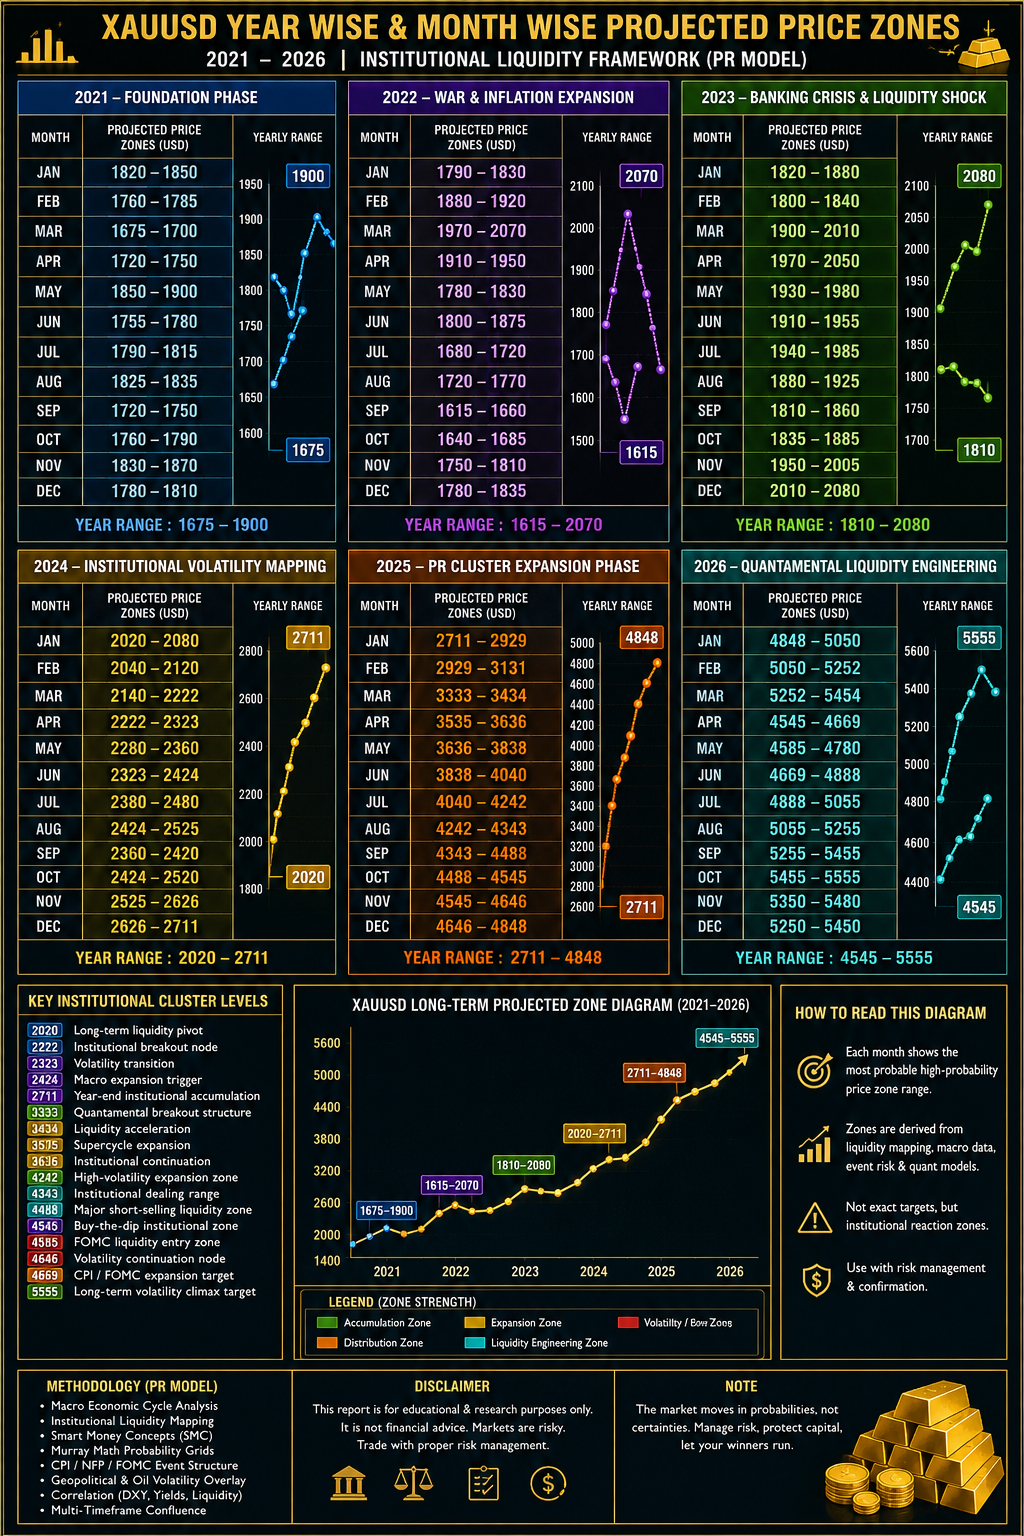
Since 2021, Piyush Ratnu’s analysis gained visibility through repeated projections of major XAUUSD price zones during highly volatile periods such as FOMC meetings, Non-Farm Payrolls (NFP), inflation releases, banking crises, geopolitical tensions, and central bank policy shifts. His research frequently highlighted structured cluster targets such as 2020, 2222, 2424, 3333, 3636, 4242, 4545, and 4646 long before these levels became mainstream market discussions. Publicly documented analysis archives, social media publications, and historical review reports have been used by followers to verify many of these projections.
 One of the defining characteristics of the PR Quant Strategy is that it does not rely on traditional “prediction-only” technical analysis. Instead, the methodology attempts to engineer probability structures around institutional liquidity behavior. The framework integrates multiple factors simultaneously, including US Dollar Index (DXY), real yields, USDJPY correlations, oil price movements, volatility expansion, macroeconomic expectations, geopolitical risk, and event-driven order-flow behavior. This multi-layered structure enables traders to interpret gold not merely as a chart pattern, but as a globally interconnected macro asset.
According to published methodology reviews, the PR framework combines more than 90–130 technical and macroeconomic parameters into a single analytical model. These include Murray Math structures, multi-timeframe support and resistance mapping, volatility compression models, session timing analysis, liquidity sweeps, and institutional sentiment interpretation. Unlike conventional retail indicators, the model focuses heavily on identifying areas where institutional positioning and retail emotional behavior collide.
The strategy’s reputation strengthened further through multiple published back-tests and performance reviews. Several publicly available reports referenced an estimated historical hit rate of approximately 85–90% in tactical level-based forecasting when measured transparently across large datasets of public calls. Independent performance pages and archived trade reviews also highlighted large-scale execution statistics and extensive historical trading activity focused primarily on XAUUSD.
From a strategic perspective, Piyush Ratnu’s research philosophy is centered around one core idea: markets are driven less by randomness and more by structured liquidity movement. His methodology treats volatility not as chaos, but as a measurable transfer of liquidity between institutions and participants. This approach became especially relevant during the post-2023 macro regime, where rising geopolitical tensions, inflation uncertainty, aggressive central bank policies, and sovereign debt concerns significantly increased gold market volatility.
Between 2021 and 2026, the PR Quant Strategy evolved from a technical trading model into a broader quantamental framework combining mathematics, economics, probability theory, and institutional market psychology. As a result, the research developed a distinct identity within the XAUUSD trading community — particularly among traders seeking structured, probability-driven analysis rather than emotional speculation.
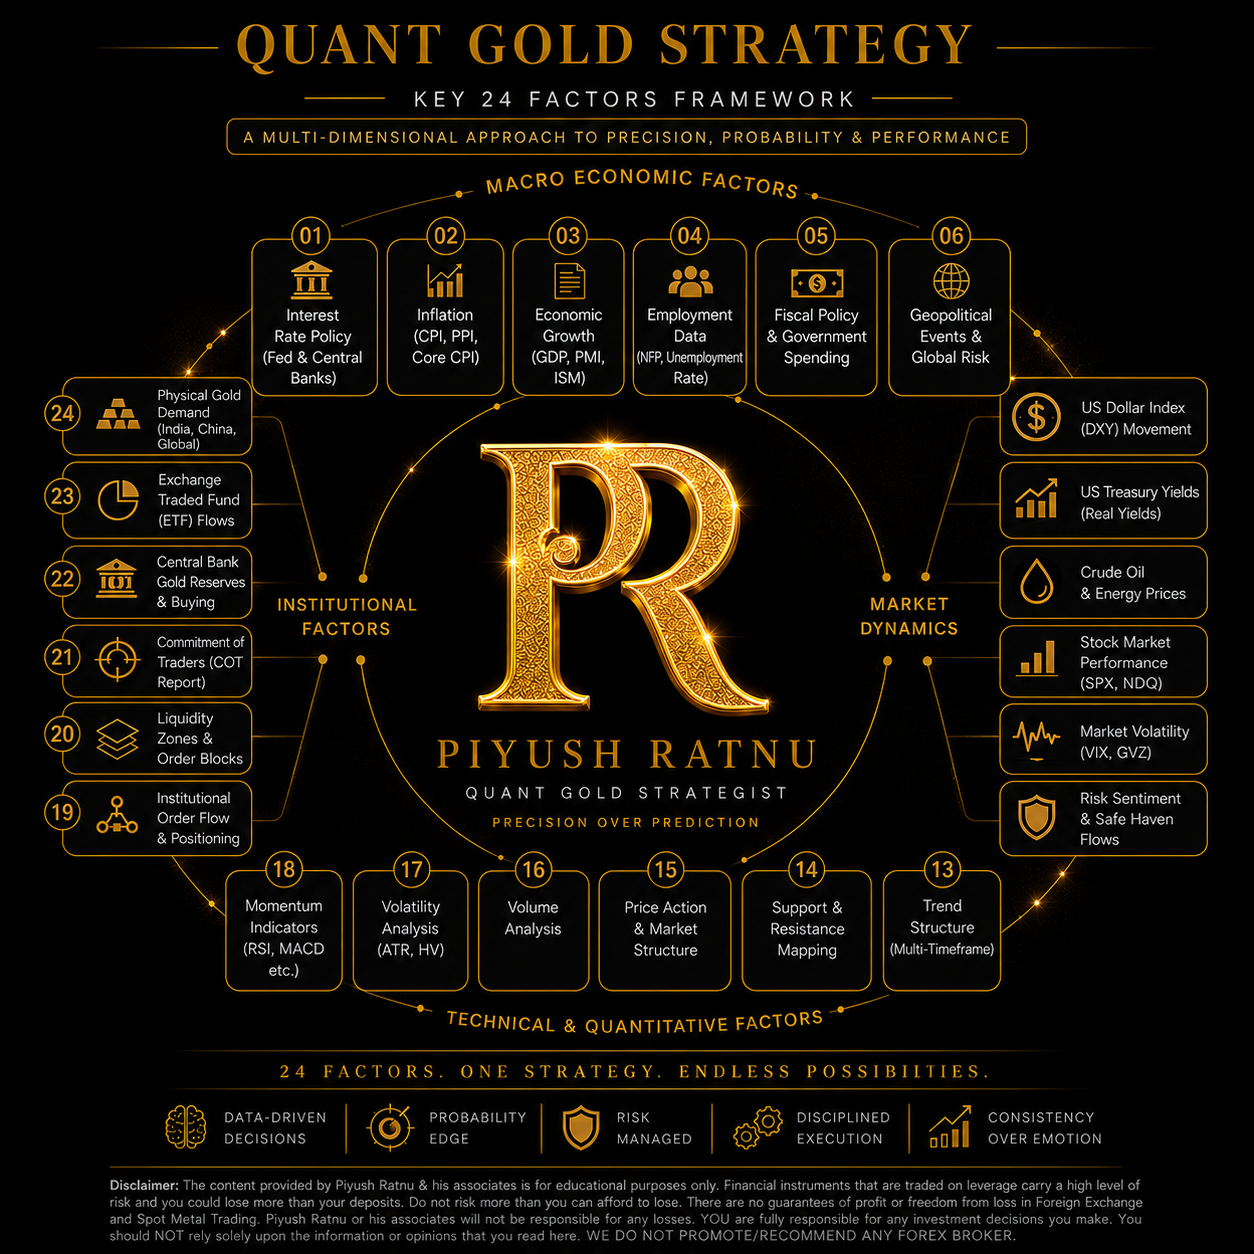
Core 369 Parameters Used in the Piyush Ratnu Quant Gold Analysis Algorithm: Golden Falcon
Golden Falcon Quant Gold Algorithm is a multi-layered XAUUSD “quantamental” architecture integrating more than 90–130 parameters across macroeconomics, liquidity engineering, volatility analytics, institutional order flow, and probability modeling.
The Core 369 Parameters commonly associated with the PR Quant Gold Analysis Algorithm framework are as follows:
I. MACROECONOMIC PARAMETERS (1–45)
- US Dollar Index (DXY)
- DXY momentum
- DXY volatility
- DXY divergence
- US 10Y yields
- US 2Y yields
- Yield curve inversion
- Real yields
- Inflation expectations
- Fed rate outlook
- FOMC projections
- Dot plot analysis
- QT expectations
- QE probability
- CPI YoY
- Core CPI
- PPI
- Core PPI
- NFP data
- ADP employment
- Unemployment rate
- Wage inflation
- Retail sales
- GDP growth
- ISM Manufacturing
- ISM Services
- Consumer confidence
- Housing data
- Jobless claims
- Treasury auctions
- Debt issuance
- Fiscal deficit
- Recession probability
- Central bank gold buying
- ECB policy
- BOJ policy
- BOE policy
- PBOC liquidity
- Emerging market reserves
- Sovereign flows
- Oil inflation risk
- Energy shock probability
- Commodity inflation
- Global liquidity conditions
- Dollar liquidity stress
II. INTERMARKET CORRELATIONS (46–90)
- USDJPY correlation
- EURUSD correlation
- GBPUSD correlation
- AUDUSD correlation
- USDCNH flows
- XAUXAG ratio
- Gold-oil correlation
- Gold-Bitcoin correlation
- Gold-Nasdaq correlation
- Gold-SPX correlation
- Bond-equity rotation
- Safe-haven demand
- Carry trade unwinding
- Emerging market stress
- Risk-on flows
- Risk-off flows
- VIX correlation
- Copper correlation
- Platinum correlation
- Palladium correlation
- Mining stocks correlation
- ETF inflows
- ETF outflows
- COMEX positioning
- Open interest changes
- Futures premium
- Futures discount
- Futures basis spread
- Treasury-gold spread
- Currency basket divergence
- Yen carry pressure
- Asian demand flows
- Chinese market flows
- Indian gold demand
- Swiss refinery demand
- Global reserve diversification
- Commodity cycle trend
- Global PMI trend
- Equity volatility spillover
- Crypto risk appetite
- US election impact
- Political uncertainty index
- Credit spreads
- Bank stress index
- Liquidity crisis probability
III. TREND & STRUCTURE PARAMETERS (91–135)
- EMA 5
- EMA 10
- EMA 21
- EMA 50
- EMA 100
- EMA 200
- SMA 20
- SMA 50
- SMA 100
- SMA 200
- VWAP
- Anchored VWAP
- Trendline slope
- Dynamic trendline breaks
- Market structure shift
- Swing highs
- Swing lows
- Higher highs
- Lower lows
- Compression zones
- Expansion zones
- Breakout zones
- Trend continuation
- Trend exhaustion
- Reversal structures
- Consolidation structures
- Price channel analysis
- Ascending triangle
- Descending triangle
- Symmetrical triangle
- Bull flags
- Bear flags
- Wedge formations
- Harmonic patterns
- Elliott Wave alignment
- Fibonacci retracement
- Fibonacci extension
- Fibonacci confluence
- Pivot points
- Weekly pivots
- Monthly pivots
- Quarterly pivots
- Dynamic support
- Dynamic resistance
- Structural breakout probability
IV. MOMENTUM & OSCILLATOR PARAMETERS (136–180)
- RSI 14
- RSI divergence
- RSI compression
- RSI expansion
- Stochastic oscillator
- Stochastic RSI
- Williams %R
- MACD histogram
- MACD crossover
- MACD divergence
- Momentum oscillator
- ROC
- CCI
- OBV
- Money Flow Index
- Volume momentum
- Delta momentum
- Accumulation/distribution
- Tick momentum
- Intraday acceleration
- Price velocity
- Trend acceleration
- Exhaustion momentum
- Multi-timeframe momentum
- Candle momentum
- Relative volume
- Session volume imbalance
- Institutional buying strength
- Institutional selling strength
- Momentum clustering
- Momentum decay
- Velocity divergence
- Pressure imbalance
- Candle rejection strength
- Reversal probability
- Trend conviction score
- Multi-session continuation
- Delta absorption
- Tick imbalance
- Bid-ask aggression
- Order-flow acceleration
- Smart momentum bias
- Intraday probability score
- Macro momentum score
- Net directional score
V. VOLATILITY PARAMETERS (181–225)
- ATR 14
- ATR expansion
- ATR compression
- Daily range statistics
- Weekly volatility
- Historical volatility
- Implied volatility
- Volatility skew
- Event volatility
- CPI volatility map
- NFP volatility map
- FOMC volatility map
- Geopolitical volatility
- Oil shock volatility
- Flash crash probability
- Black swan modeling
- Liquidity vacuum analysis
- Range expansion model
- Session volatility
- Asian session range
- London volatility
- NY session volatility
- Opening range breakout
- Mean reversion probability
- Volatility clustering
- Volatility decay
- Volatility breakout probability
- Gamma squeeze potential
- Tail risk analysis
- Overnight gap volatility
- Weekend gap volatility
- Options implied movement
- Volatility seasonality
- Volatility percentile rank
- Compression breakout probability
- Price acceleration bands
- Keltner channels
- Bollinger Bands
- Donchian channels
- Dynamic volatility bands
- Stress-event simulation
- Risk regime transition
- High-impact event clustering
- Liquidity shock expansion
- Volatility-adjusted positioning
VI. LIQUIDITY & INSTITUTIONAL FLOW PARAMETERS (226–270)
- Liquidity sweeps
- Equal highs liquidity
- Equal lows liquidity
- Stop-hunt zones
- Institutional liquidity pools
- Buy-side liquidity
- Sell-side liquidity
- Smart money accumulation
- Smart money distribution
- Fair Value Gaps
- Order blocks
- Breaker blocks
- Mitigation blocks
- BOS structures
- CHOCH structures
- Premium zones
- Discount zones
- SMT divergence
- Liquidity engineering
- Institutional trap zones
- Session trap structures
- London trap
- New York reversal trap
- Asian accumulation
- DOM analysis
- Footprint charts
- Volume profile
- Market depth imbalance
- Iceberg orders
- Dark pool flows
- Bid dominance
- Ask dominance
- Delta absorption
- Tape reading
- Institutional participation score
- Liquidity exhaustion
- Market maker positioning
- Dealer inventory imbalance
- High-frequency liquidity
- Auction market imbalance
- Tick distribution analysis
- Stop cascade probability
- Liquidity void analysis
- Institutional reaction zones
- Algorithmic liquidity mapping
VII. EVENT-DRIVEN PARAMETERS (271–315)
- FOMC reaction sequencing
- Powell speech impact
- CPI reaction structure
- NFP reaction structure
- PPI reaction structure
- ECB press conference impact
- BOJ intervention risk
- Treasury announcement impact
- OPEC meeting impact
- Oil inventory impact
- US election cycle
- Geopolitical escalation timing
- War-risk premium
- Ceasefire probability
- Sanctions impact
- Banking crisis contagion
- Credit event probability
- Sovereign downgrade risk
- US-China tension
- Taiwan conflict probability
- Middle East escalation
- Strait of Hormuz disruption
- Fed blackout period
- Quad witching impact
- Month-end rebalancing
- Quarter-end positioning
- Year-end flows
- Central bank speeches
- Jackson Hole impact
- CPI revision risk
- Employment revisions
- Seasonal gold demand
- Diwali demand cycle
- Chinese New Year demand
- ETF reallocation cycle
- Futures expiry effects
- COMEX rollover pressure
- Institutional hedging cycle
- Options expiry magnet
- Macro surprise index
- Surprise deviation scoring
- Event probability weighting
- Event correlation matrix
- Event-driven liquidity score
- Macro-event execution score
VIII. QUANTITATIVE & PROBABILITY PARAMETERS (316–369)
- Probability weighting engine
- Monte Carlo simulation
- Correlation matrix
- Regression analysis
- Z-score modeling
- Standard deviation mapping
- Price distribution curves
- Statistical mean reversion
- Cluster centroid mapping
- Cluster number analysis
- Volatility distribution
- Trade expectancy
- Sharpe ratio
- Sortino ratio
- Drawdown probability
- Win-rate optimization
- Risk-reward optimization
- Position sizing model
- Portfolio heat mapping
- Trade frequency analysis
- Trade duration analysis
- Liquidity-adjusted risk
- Exposure weighting
- Correlation-adjusted exposure
- Multi-factor scoring
- Signal confidence score
- Institutional probability score
- Macro probability score
- Technical probability score
- Liquidity probability score
- Weighted directional bias
- AI-assisted scoring
- Algorithmic confidence ranking
- Dynamic execution probability
- Recovery probability mapping
- Drawdown recovery modeling
- Scenario stress testing
- Dynamic hedge ratios
- Quantamental alignment score
- Signal clustering
- Multi-timeframe synchronization
- Execution timing model
- Trade sequencing engine
- Liquidity timing engine
- Volatility timing engine
- Institutional bias filter
- Dynamic range probability
- High-probability zone mapping
- Algorithmic retracement engine
- Reversal probability engine
- Trend continuation engine
- Institutional volatility model
- Quantamental liquidity engine
- PR Gold Probability Matrix
 The methodology combines macroeconomics, liquidity engineering, volatility structures, intermarket correlations, institutional behavior, and probability-weighted execution to identify high-probability XAUUSD zones rather than exact price prediction.