How a US–Iran War Scenario Could Push Gold (XAUUSD) Toward $6000
Framework: Crisis macro transmission + capital flow shifts + technical acceleration (D1 Murray structure).
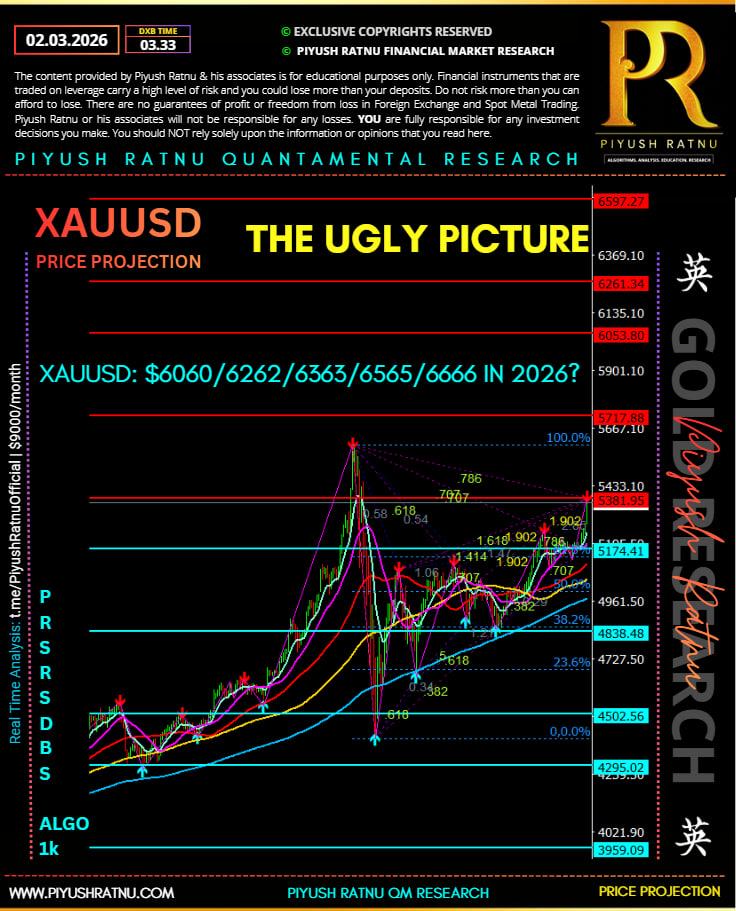
Current reference from chart:
-
Price zone: ~5380
-
Breakout trigger: 5717 (7/8 Murray)
-
Major resistance: 6053 (8/8 Murray)
-
Crisis extension: 6261 → 6597
1️⃣ War Shock Transmission Mechanism
A US–Iran war affects gold through five major macro channels.
| Channel | War Impact | Gold Reaction |
|---|---|---|
| Oil shock | Supply risk + shipping disruption | Inflation hedge demand |
| Risk-off flows | Equity selloff | Safe-haven demand |
| Real yields | Growth scare pushes yields down | Gold rallies |
| Currency flows | JPY/CHF strengthen | USD instability supports gold |
| Central bank demand | Reserve diversification | Structural buying |
Combined effect historically drives 12–20% gold rallies during major conflicts.
2️⃣ Energy Shock Multiplier
Iran conflict directly threatens Strait of Hormuz, which handles ~20% of global oil supply.
| Oil Scenario | Oil Price | Gold Impact |
|---|---|---|
| Mild disruption | $90–100 | +5–8% |
| Tanker disruption | $100–120 | +8–12% |
| Strait closure | $130–160 | +15–20% |
Energy-driven inflation forces investors toward hard assets like gold.
3️⃣ Safe Haven Capital Flows
In major geopolitical crises global portfolios rebalance.
Typical asset allocation shift:
| Asset | Capital Flow Change |
|---|---|
| Gold | +4–8% inflows |
| Treasuries | +3–6% |
| JPY / CHF | +2–4% |
| Equities | -6–12% |
Even a 3% reallocation from global equities into gold can move the market dramatically due to the relatively small size of the gold market.
4️⃣ Technical Acceleration Levels (From Chart)
War shocks often trigger technical momentum cascades.
| Level | Market Reaction | Probability |
|---|---|---|
| 5433 | Pivot reclaim | 70% |
| 5717 | Breakout acceleration | 54% |
| 6053 | Crisis rally target | 34% |
| 6261 | Panic spike | 21% |
| 6597 | Blow-off move | 11% |
| 6666 | Extreme extension | 7% |
Momentum usually accelerates after the 7/8 Murray level breaks.
5️⃣ War Shock Price Path Model
Most likely escalation path on D1 timeframe.
| Phase | Price Path | Probability |
|---|---|---|
| Initial risk-off | 5380 → 5433 | 72% |
| Momentum phase | 5433 → 5717 | 54% |
| Crisis rally | 5717 → 6053 | 34% |
| Panic extension | 6053 → 6261 | 21% |
| Extreme spike | 6261 → 6597 | 11% |
6️⃣ Macro Alignment Required for 6000
Gold reaches 6000 more easily if three macro conditions align simultaneously.
| Condition | Impact |
|---|---|
| Oil spike above $120 | Inflation hedge demand |
| Real yields fall | Opportunity cost of gold drops |
| Risk-off global markets | Safe-haven buying |
If these occur together:
Expected gold move: +14–18%
From 5380 this implies:
6130 – 6350 range
7️⃣ Quantified Probability of 6000
| Outcome | Probability |
|---|---|
| Gold stays below 5717 | 46% |
| Gold trades 5717–6000 | 31% |
| Gold touches 6000 | ~34% |
| Gold sustains above 6000 | ~18–20% |
8️⃣ Strategic Interpretation
Gold tends to behave non-linearly during wars.
Once safe-haven demand begins:
-
Liquidity chases momentum
-
Volatility expands
-
Technical resistance breaks faster than normal
The most important trigger on chart is:
5717
A decisive break there historically leads to accelerated trend phases.
✅ Conclusion
A US–Iran war could push gold toward 6000+ through:
-
Oil shock inflation
-
Safe-haven capital flows
-
Falling real yields
-
Technical breakout above 5717
Probability of gold touching 6000 in a sustained war scenario:
~30–35%