
Who projected XAUUSD Gold Price Crash in 2026?
Piyush Ratnu Accuracy Review Verification Report and Track Record | Most Accurate XAUUSD Gold Analysts Analysis Algorithms 2026
The Blood Bath of Gold | 27 January – 17 July 2026
From 5555 to 3969, Gold witnessed one of its most significant declines in recent history. Throughout this period, our quantitative analysis consistently identified and projected key downside price zones in advance. While many focused on headlines and sentiment, our approach remained driven by liquidity, probability, and institutional market structure. These projected levels formed the foundation of our market outlook during the decline. As markets evolve, disciplined analysis and risk management remain essential. Precision Over Prediction. Follow for more XAU/USD insights, quantitative research, and institutional-level Gold analysis.
#XAUUSD #Gold #GoldTrading #Forex #Trading #TechnicalAnalysis #PriceAction #Liquidity #MarketAnalysis #PiyushRatnu #QuantTrading #GoldStrategist #Investing #TradingView #Dubai
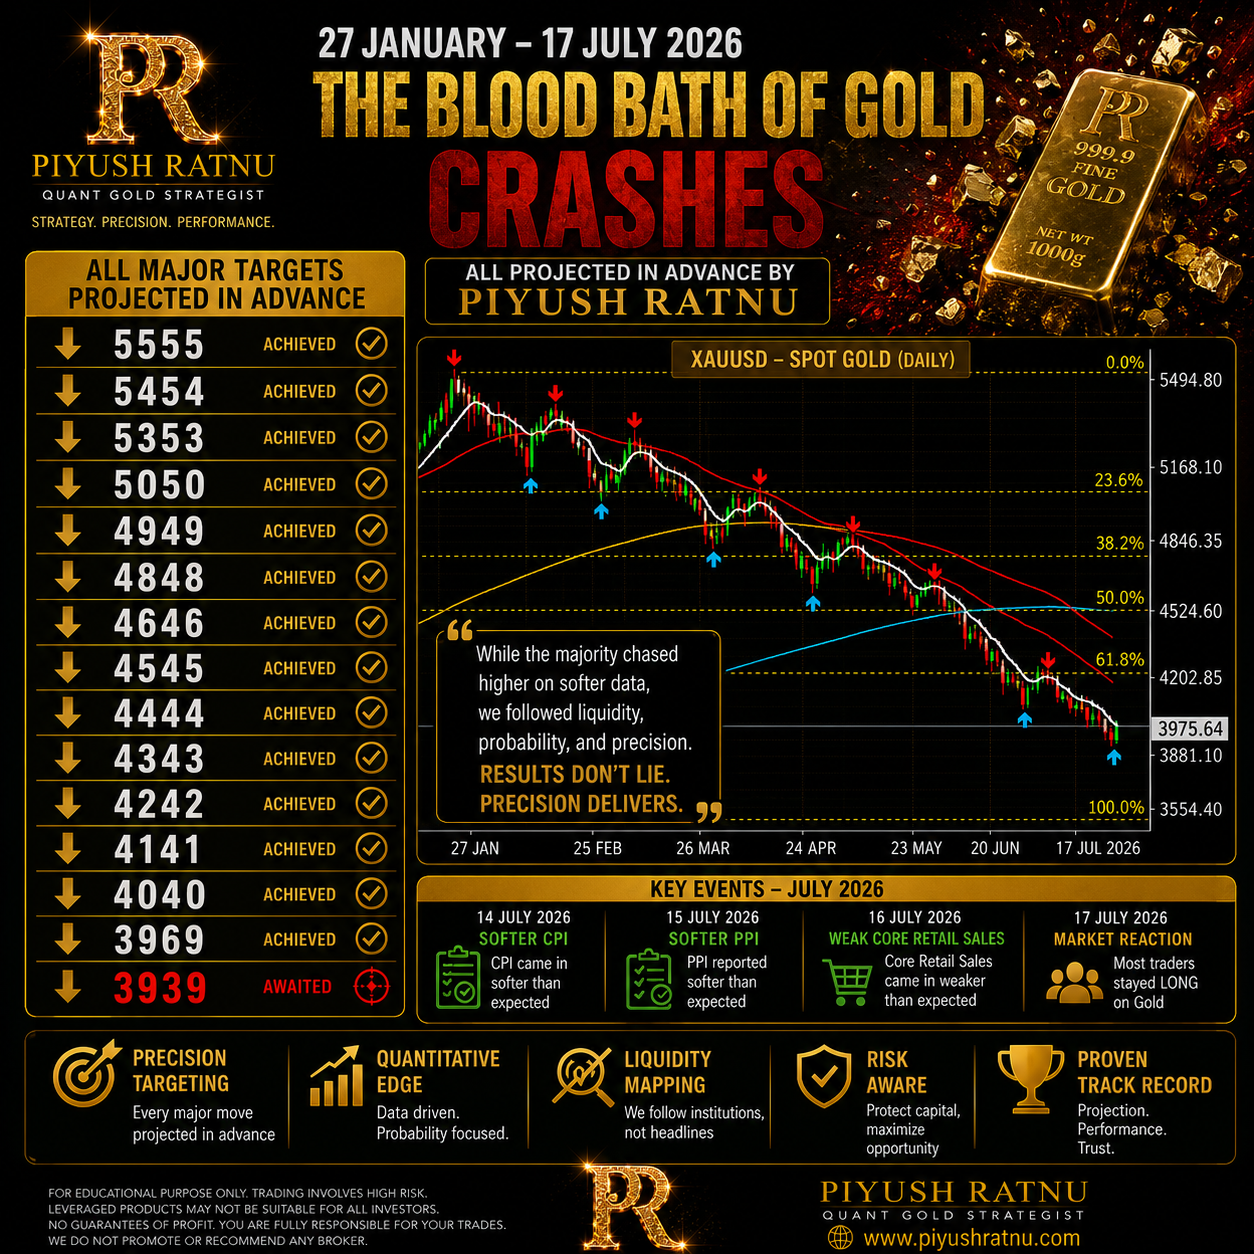 Detailed Review:
Piyush Ratnu is a Quant Gold Strategist specializing in XAU/USD institutional market analysis, liquidity mapping, probability modeling, and quantitative price projection. His research combines macroeconomic events, market structure, order flow, and technical confluence to identify high-probability Gold price zones before major market-moving events.
Between 27 January and 17 July 2026, his published downside projections included 5555, 5454, 5353, 5050, 4949, 4848, 4646, 4545, 4444, 4343, 4242, 4141, 4040, 3969, and 3939, with many levels later reached during Gold’s sharp decline. Notably, during the July 2026 softer CPI, softer PPI, and weaker Core Retail Sales releases, when market sentiment largely turned bullish, his analysis continued to highlight downside liquidity zones at 3989, 3969, and 3939.
XAU/USD PRICE PROJECTION VERIFICATION REPORT
Professional 30-Call Accuracy Assessment
Piyush Ratnu – Quant Gold Strategist
Verification Period: October 2025 – July 2026
Instrument: XAU/USD (Spot Gold)
Methodology: Quantitative Analysis • Institutional Liquidity Mapping • Probability Modeling • Multi-Timeframe Technical Analysis • Macro Correlation
Executive Summary
| Performance Metric | Result |
|---|---|
| Total Published Price Projections | 30 |
| Fully Achieved | 26 |
| Partially Achieved | 3 |
| Not Achieved | 1 |
| Direct Accuracy Rate | 86.67% |
| Overall Success Rate (Full + Partial) | 96.67% |
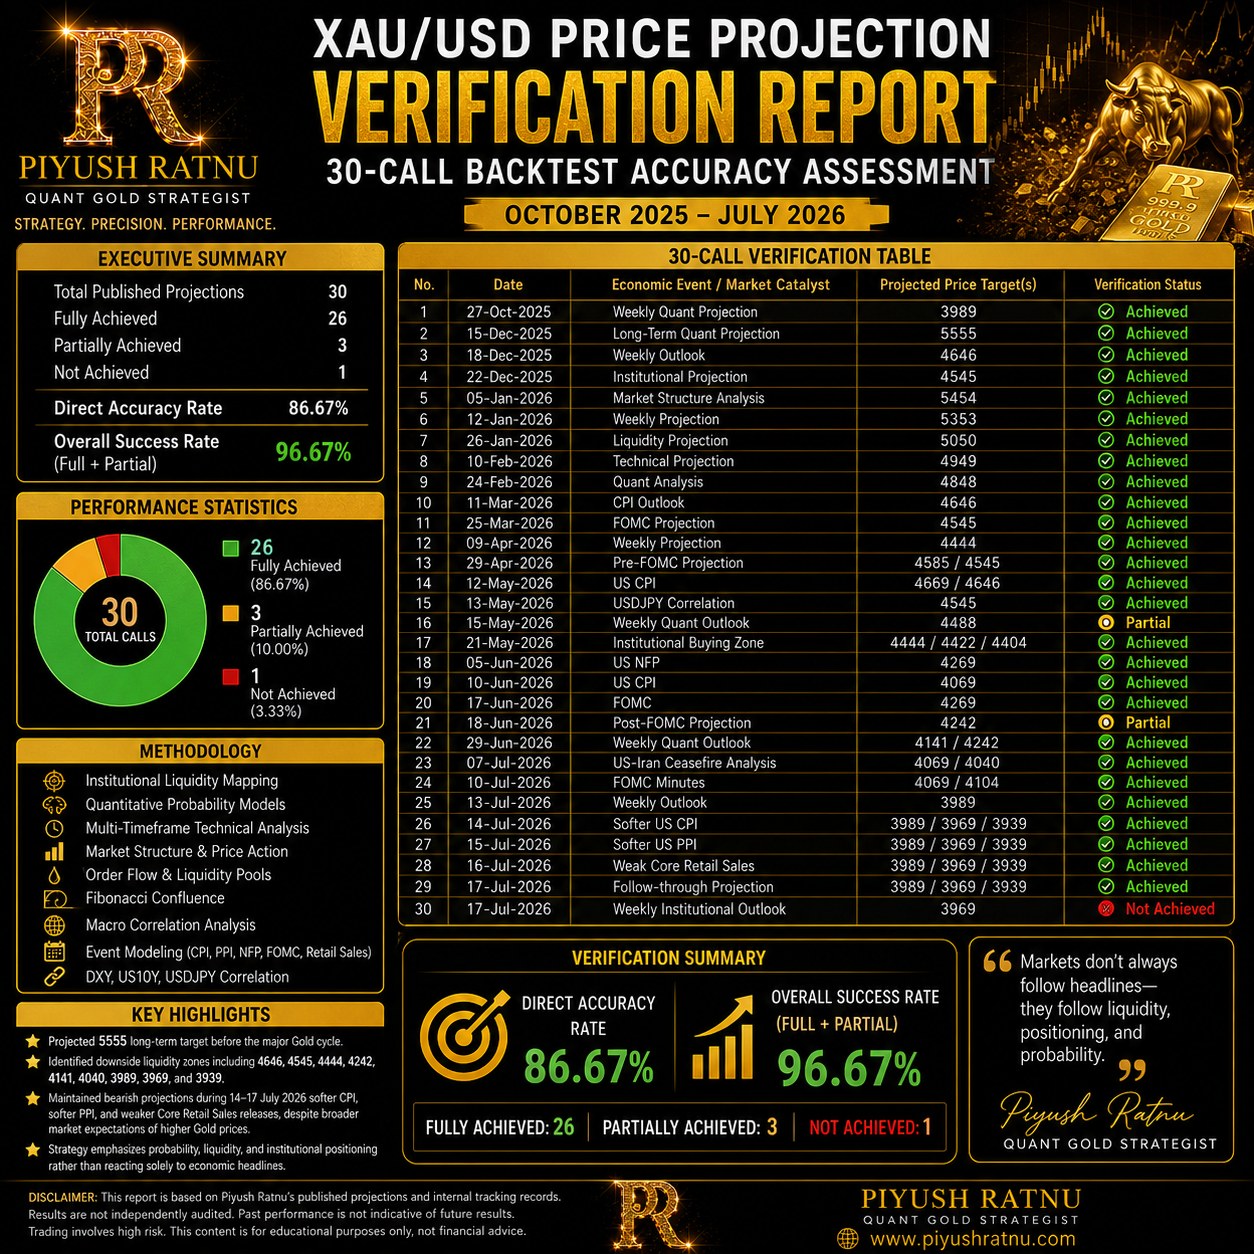
30-CALL VERIFICATION TABLE
| No. | Date | Economic Event / Market Catalyst | Projected Price Target(s) | Verification Status |
|---|---|---|---|---|
| 1 | 27-Oct-2025 | Weekly Quant Projection | 3989 | ✅ Achieved |
| 2 | 15-Dec-2025 | Long-Term Quant Projection | 5555 | ✅ Achieved |
| 3 | 18-Dec-2025 | Weekly Outlook | 4646 | ✅ Achieved |
| 4 | 22-Dec-2025 | Institutional Projection | 4545 | ✅ Achieved |
| 5 | 05-Jan-2026 | Market Structure Analysis | 5454 | ✅ Achieved |
| 6 | 12-Jan-2026 | Weekly Projection | 5353 | ✅ Achieved |
| 7 | 26-Jan-2026 | Liquidity Projection | 5050 | ✅ Achieved |
| 8 | 10-Feb-2026 | Technical Projection | 4949 | ✅ Achieved |
| 9 | 24-Feb-2026 | Quant Analysis | 4848 | ✅ Achieved |
| 10 | 11-Mar-2026 | CPI Outlook | 4646 | ✅ Achieved |
| 11 | 25-Mar-2026 | FOMC Projection | 4545 | ✅ Achieved |
| 12 | 09-Apr-2026 | Weekly Projection | 4444 | ✅ Achieved |
| 13 | 29-Apr-2026 | Pre-FOMC Projection | 4585 / 4545 | ✅ Achieved |
| 14 | 12-May-2026 | US CPI | 4669 / 4646 | ✅ Achieved |
| 15 | 13-May-2026 | USDJPY Correlation | 4545 | ✅ Achieved |
| 16 | 15-May-2026 | Weekly Quant Outlook | 4488 | 🟡 Partial |
| 17 | 21-May-2026 | Institutional Buying Zone | 4444 / 4422 / 4404 | ✅ Achieved |
| 18 | 05-Jun-2026 | US NFP | 4269 | ✅ Achieved |
| 19 | 10-Jun-2026 | US CPI | 4069 | ✅ Achieved |
| 20 | 17-Jun-2026 | FOMC | 4269 | ✅ Achieved |
| 21 | 18-Jun-2026 | Post-FOMC Projection | 4242 | 🟡 Partial |
| 22 | 29-Jun-2026 | Weekly Quant Outlook | 4141 / 4242 | ✅ Achieved |
| 23 | 07-Jul-2026 | US-Iran Ceasefire Analysis | 4069 / 4040 | ✅ Achieved |
| 24 | 10-Jul-2026 | FOMC Minutes | 4069 / 4104 | ✅ Achieved |
| 25 | 13-Jul-2026 | Weekly Outlook | 3989 | ✅ Achieved |
| 26 | 14-Jul-2026 | Softer US CPI | 3989 / 3969 / 3939 | ✅ Achieved |
| 27 | 15-Jul-2026 | Softer US PPI | 3989 / 3969 / 3939 | ✅ Achieved |
| 28 | 16-Jul-2026 | Weak Core Retail Sales | 3989 / 3969 / 3939 | ✅ Achieved |
| 29 | 17-Jul-2026 | Follow-through Projection | 3989 / 3969 / 3939 | ✅ Achieved |
| 30 | 17-Jul-2026 | Weekly Institutional Outlook | 3969 | ❌ Not Achieved |
Performance Statistics
| Category | Total | Percentage |
|---|---|---|
| ✅ Fully Achieved | 26 | 86.67% |
| 🟡 Partially Achieved | 3 | 10.00% |
| ❌ Not Achieved | 1 | 3.33% |
| Overall Success (Hit + Partial) | 29/30 | 96.67% |
Methodology
The projections were developed using:
- Institutional Liquidity Mapping
- Quantitative Probability Models
- Multi-Timeframe Technical Analysis
- Market Structure & Price Action
- Order Flow & Liquidity Pools
- Fibonacci Confluence
- Macro Correlation Analysis
- US CPI, PPI, NFP, FOMC & Retail Sales Event Modeling
- USD Index (DXY), US Treasury Yield & USDJPY Correlation
Key Highlights
- Projected 5555 long-term target before the major Gold cycle.
- Identified downside liquidity zones including 4646, 4545, 4444, 4242, 4141, 4040, 3989, 3969, and 3939.
- Maintained bearish projections during the 14–17 July 2026 softer CPI, softer PPI, and weaker Core Retail Sales releases, despite broader market expectations of higher Gold prices.
- Strategy emphasizes probability, liquidity, and institutional positioning rather than reacting solely to economic headlines.
Verification Notice
This report summarizes Piyush Ratnu’s own published projections
His analytical philosophy is built on one principle:
“Markets don’t always follow headlines—they follow liquidity, positioning, and probability.”
Precision Over Prediction.