Looking to the data for hints towards ideal speculative opportunities, we can objectively deduce what may or may not be an ideal play to take in the currency markets when scanning for trades.
If you have not seen a heat map like this before, they have been typically used for equities/currency/forex trading, which can sometimes be a minefield for the novice trader when they are attempting to find a suitable stock to trade.
Remember that while there are literally hundreds of stocks/currencies to choose from, we also have individual sectors and industries to choose from, too. The smart trader will use tools such as heat maps to identify the strongest and weakest sectors and industries and find the best stocks to trade within them, so as to increase his or her odds for success.
Use the table below to view in real time the strongest and weakest currencies in each time frame. You can switch the search mode to pips or percent.
MARKET VOLATILITY
Find the least and/or most volatile Forex currencies in real time.
FOREX LIQUIDITY
The liquidity section provides rough estimates of the trading activity in the forex market. It allows you to understand and view current liquidity and liquidity in previous sessions, in real time. Higher liquidity usually means better spreads as more transactions are being made. The liquidity calculation takes into account many brokers and top 10 traded currencies to calculate the liquidity per each minute for the last 48 hours. You can use the chart zoom in feature to zoom/select a custom timeframe and have the liquidity automatically calculated. The average liquidity of the past 24 hours is used as a 100% liquidity basis for percentage calculation (number of ticks divided by average spread). For example, a 110% reading will tell you that the current liquidity is 10% above the last 24 hours average liquidity.
10 Customized Charting Tools by Piyush Ratnu:
- PR SR T: No repaint till 24 hours
- PR Fib Trace: Live mapping of market movement per chart
- PR Close All Robot: The robot can close up to 100 trades in a click
- PR Modify TP: TP can be set using this on more than 100 trades in 25 seconds
- MCT: Multi-Currency Trader, Trade 27 currencies in a single click
- PR SOK: Combination of SOC and Zig Zag with custom values
- PR PTP R: Modified version of Super Trend Indicator with custom values
- PRFxDG: Trend Mapping with Dimension Degrees based mapping
- PR FX SC: Live Market Scanner 7 Parameters Mapping on one screen
- PR SIGNS: Probability Reversal and Ratios on High Volatility / candles
For charges, guidance and guided training monitored by experts for 7 days,
please write us at piyushratnu@gmail.com
Join our official Paid Telegram Channel for LIVE trading feed and analysis here: https://t.me/PiyushRatnuGoldAnalysis
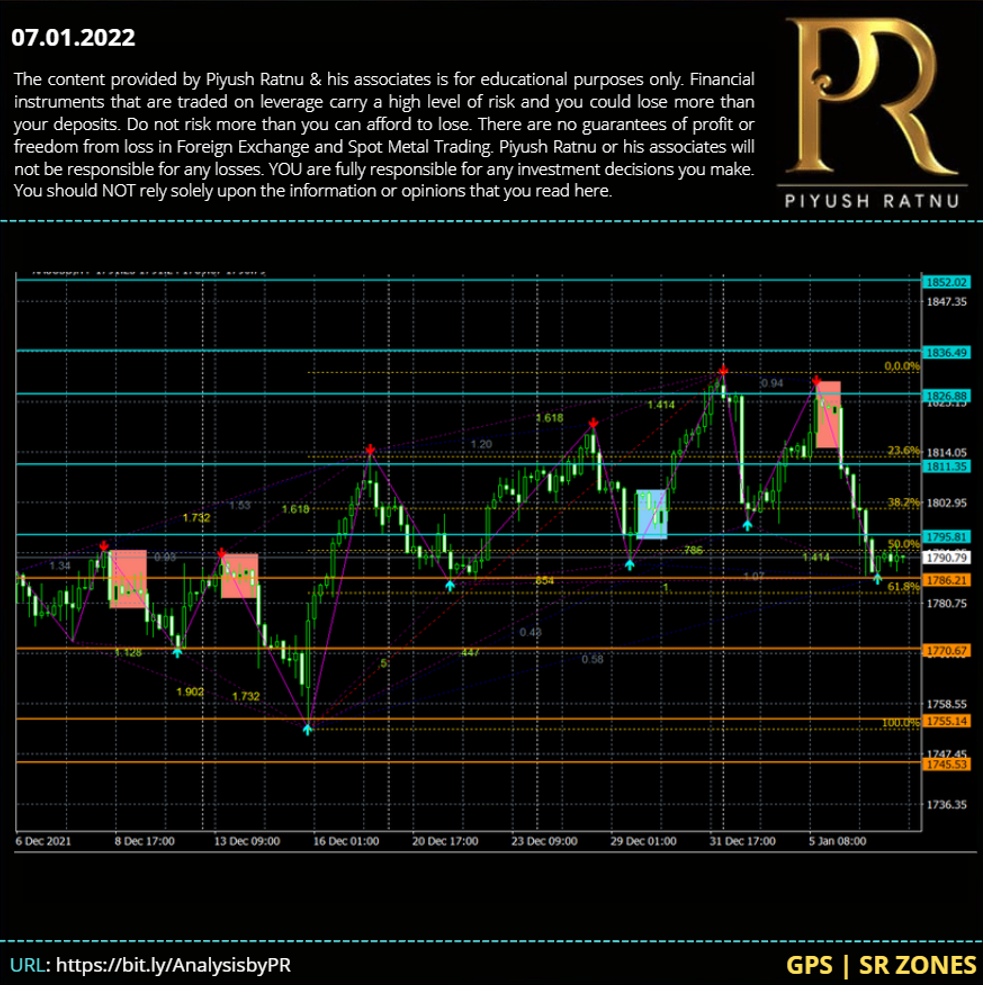
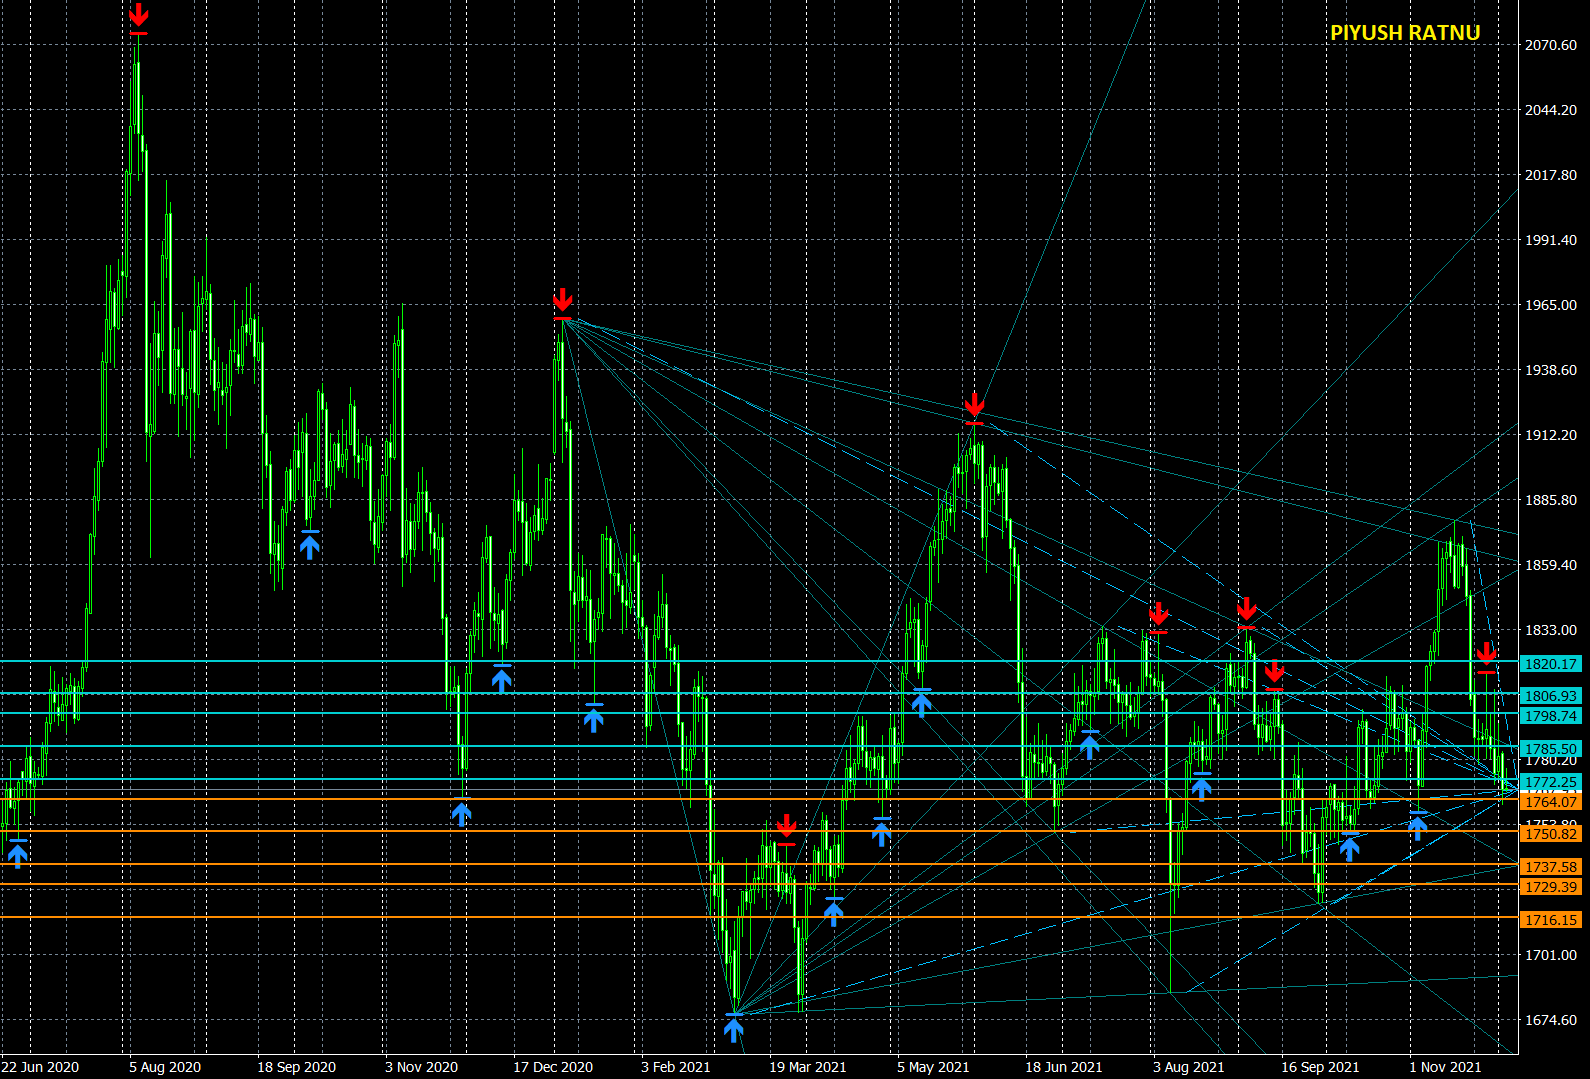
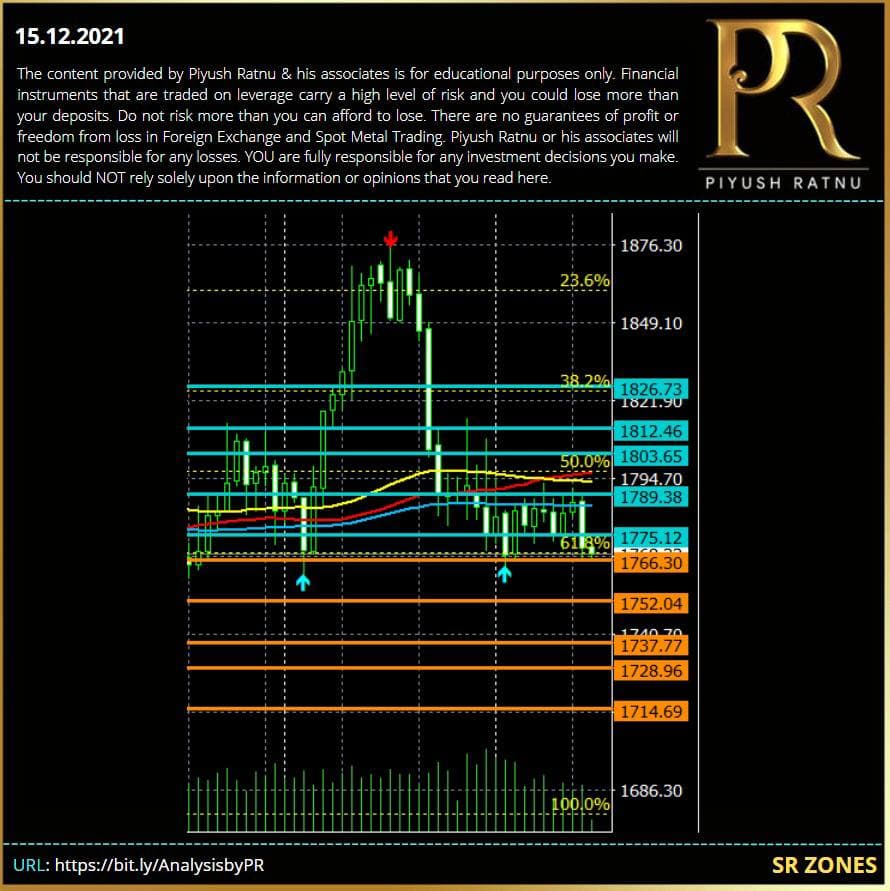
Piyush Ratnu | Trading Tips | Forex Glossary | Trading Tutorials | Spot Gold | Forex 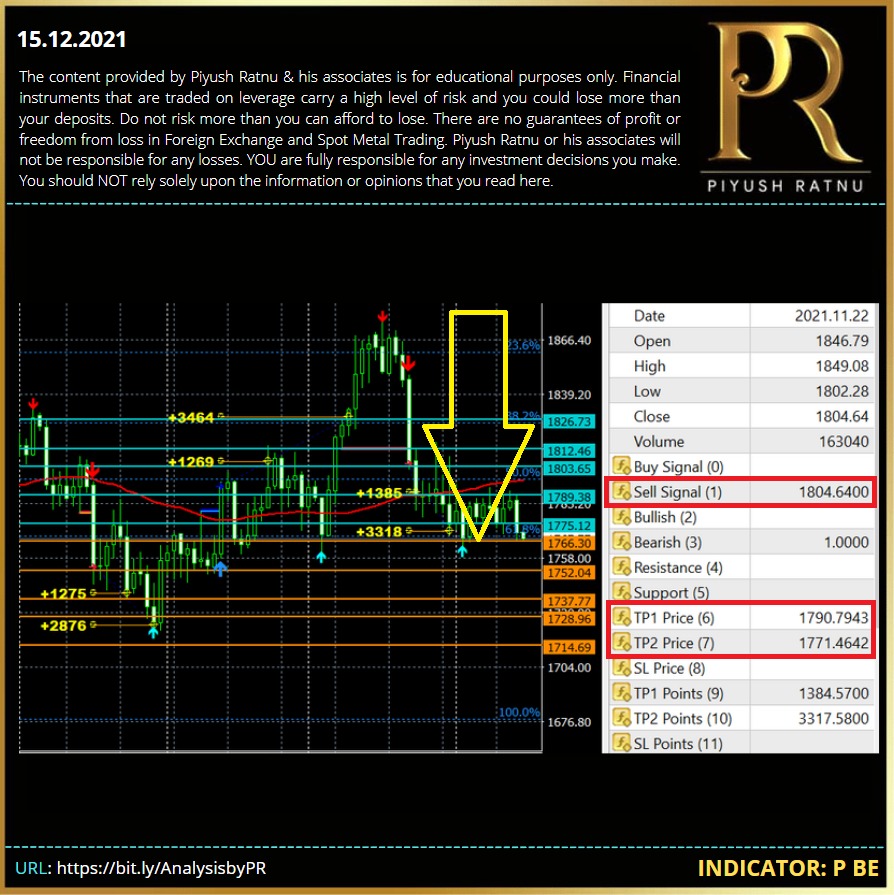
XAUUSD | GOLD | Analysis | Forex Trading tips | Piyush Ratnu How to trade XAUUSD with accuracy | Trading tips | Forex Analysis | Piyush Ratnu 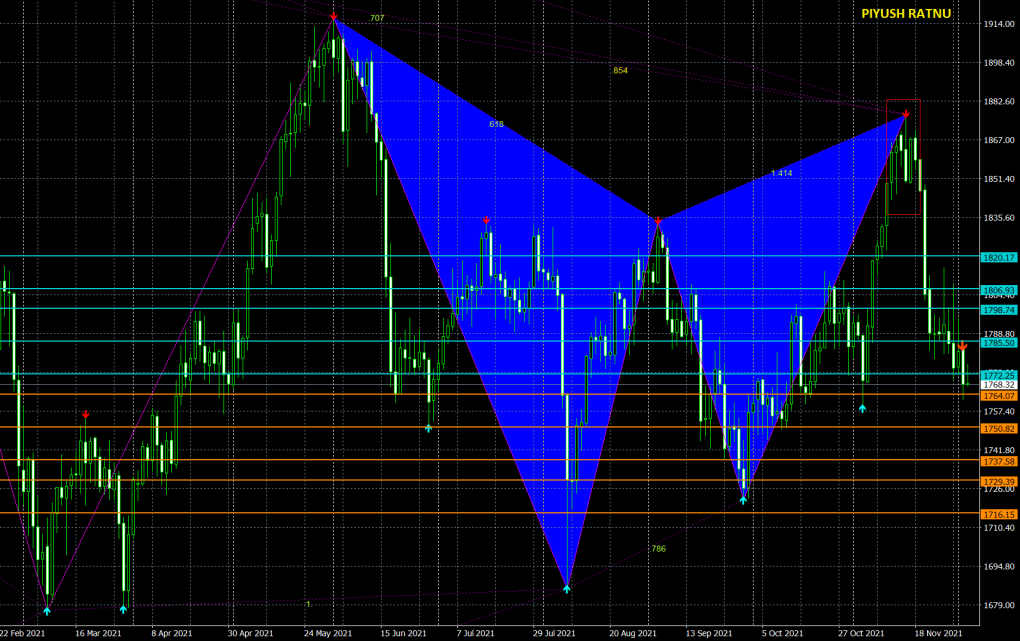
Piyush Ratnu | Trading Tips | Forex Glossary | Trading Tutorials | Spot Gold | Forex 
Piyush Ratnu | Trading Tips | Forex Glossary | Trading Tutorials | Spot Gold | Forex 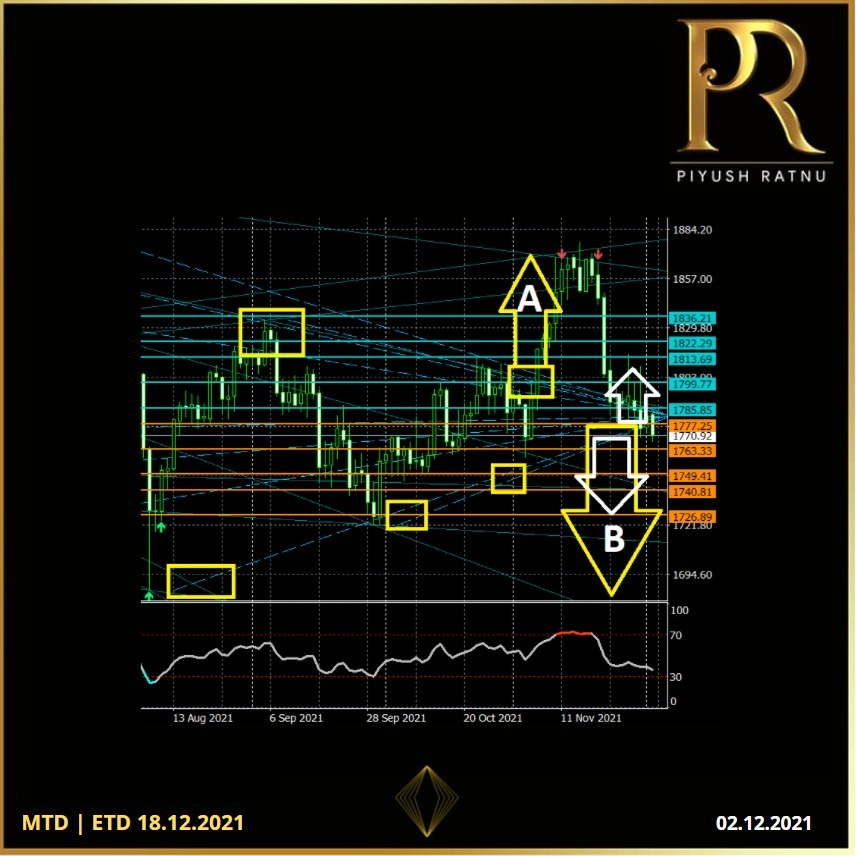
Piyush Ratnu | Trading Tips | Forex Glossary | Trading Tutorials | Spot Gold | Forex 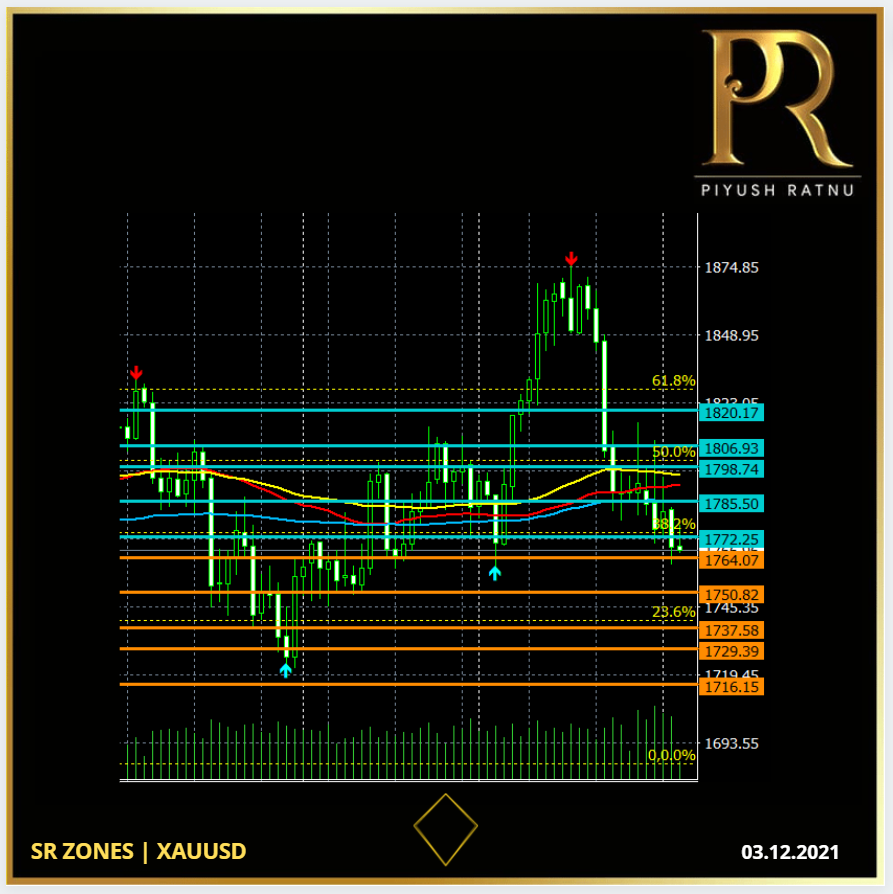
Piyush Ratnu | Trading Tips | Forex Glossary | Trading Tutorials | Spot Gold | Forex