19.03.2026 | 18.18
Global Macro Note: Energy Shock → Policy Constraint → Cross-Asset Repricing
1️⃣ Structural Shift: From Logistics Risk to Geological Risk
-
The conflict has transitioned from transport disruption (shipping lanes, tankers, pipelines) to upstream production risk (oil & gas fields).
-
This marks a non-linear escalation:
-
Logistics disruptions → reroutable, temporary
-
Reservoir damage → irreversible in short-term, capital-intensive rebuild
-
-
The market shifts from pricing delay risk → capacity destruction risk.
-
Result: Oil pricing embeds supply persistence premium, not just disruption volatility.
➡ Economic Correlation:
Supply shock → Cost-push inflation ↑ → Growth uncertainty ↑
2️⃣ Energy as the Macro Anchor (New Pricing Axis)
-
Oil has transitioned from a headline variable → system-wide pricing anchor.
-
Markets are no longer pricing isolated assets but re-pricing through energy cost assumptions.
Transmission Channels:
| Channel | Impact |
|---|---|
| Input costs | Inflation ↑ |
| Corporate margins | Earnings ↓ |
| Consumption | Demand ↓ |
| Trade balances | External imbalances ↑ |
➡ Oil becomes the primary macro transmission mechanism.
3️⃣ Cross-Asset Correlation Breakdown (Now Re-linked via Oil)
| Asset Class | Reaction | Economic Explanation |
|---|---|---|
| Equities | Sell-off | Margin compression + growth risk |
| Bonds | Yields ↑ | Inflation expectations ↑ |
| US Dollar | Strength | Financial tightening reflex |
| Gold / Bitcoin | Weakness | Liquidity-driven liquidation |
| Commodities (Energy) | Surge | Structural scarcity pricing |
➡ Markets are no longer diversified — they are correlated through energy risk.
4️⃣ Liquidity Regime Shift: From Valuation to Survival
-
Market behavior reflects forced deleveraging, not valuation adjustment.
-
“Safe havens” failed due to:
-
Position overcrowding
-
Margin liquidation dynamics
-
➡ When liquidity tightens → everything becomes a source of cash.
5️⃣ Federal Reserve Constraint (Policy Collision)
-
The Federal Reserve faces a dual-shock environment:
| Shock Type | Effect |
|---|---|
| Supply-side (energy) | Inflation ↑ |
| Demand-side (growth) | Economic slowdown |
-
Policy dilemma:
-
Tighten → worsens slowdown
-
Ease → fuels inflation
-
➡ This creates a policy constraint regime, not a policy choice regime.
6️⃣ “Higher for Longer” – Not Guidance, But Constraint
-
The phrase now reflects structural limitation, not forward guidance.
-
If oil remains elevated:
-
Inflation remains sticky
-
Real rates cannot fall aggressively
-
➡ The Fed is reacting to energy, not controlling inflation.
7️⃣ Energy Shock as a Growth Tax
-
At elevated oil levels:
-
Energy acts as a hidden tax on global demand
-
-
Dual effect:
| Short-Term | Medium-Term |
|---|---|
| Inflation ↑ | Demand destruction ↓ |
| Rates stay high | Growth slows |
➡ This creates a stagflationary impulse.
8️⃣ Supply vs Access: Critical Market Distinction
-
Markets are no longer pricing:
-
“How much oil exists”
-
-
Instead pricing:
-
“How much oil is accessible”
-
| Factor | Risk |
|---|---|
| Strait disruptions | Flow uncertainty |
| Infrastructure damage | Capacity loss |
| Selective transit | Conditional supply |
➡ Access risk > Supply risk
9️⃣ Regime Shift: From Disruption to Erosion
-
Earlier phase:
→ Temporary disruption, reversible -
Current phase:
→ Structural erosion, cumulative
➡ Market uncertainty rises because:
-
Damage is not directly observable
-
Pricing becomes inference-driven (via volatility)
🔟 Macro Feedback Loop (Sequence)
-
Energy shock (supply damage)
-
Oil prices surge
-
Inflation expectations rise
-
Yields increase
-
Financial conditions tighten
-
Risk assets sell off
-
Liquidity contracts
-
Demand weakens
-
Fed constrained
-
System re-prices through energy
📊 System State: New Regime
| Variable | Current Regime |
|---|---|
| Inflation | Sticky / supply-driven |
| Growth | Slowing |
| Policy | Constrained |
| Volatility | Elevated |
| Correlation | High across assets |
🧠 Piyush Ratnu Core Insight
“When energy becomes the constraint, policy becomes reactive, and markets stop pricing value — they price survival.”
✅ Strategic Summary
-
Oil is no longer a commodity — it is the macro control variable
-
The Fed is no longer leading — it is being led by energy dynamics
-
Markets have shifted from diversification → correlation → systemic risk pricing
-
The key question is no longer:
-
“Where should price be?”
-
but
-
“How much scarcity can the system absorb?”
-
————————————————————————————–
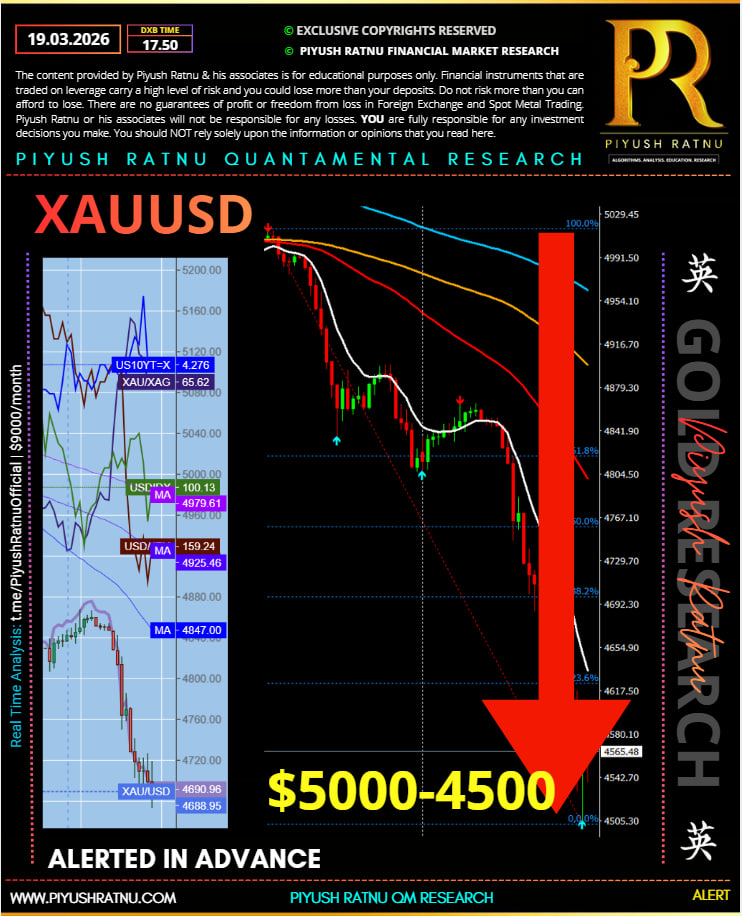
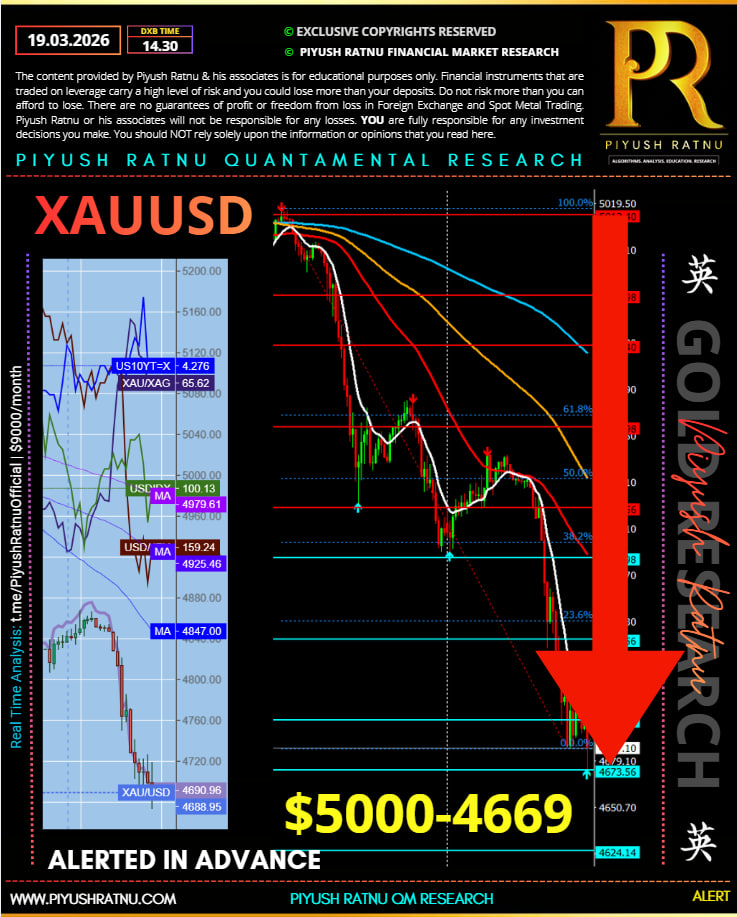
19.03.2026 | 14.36
Institutional Liquidity Map
| Zone | Behavior |
|---|---|
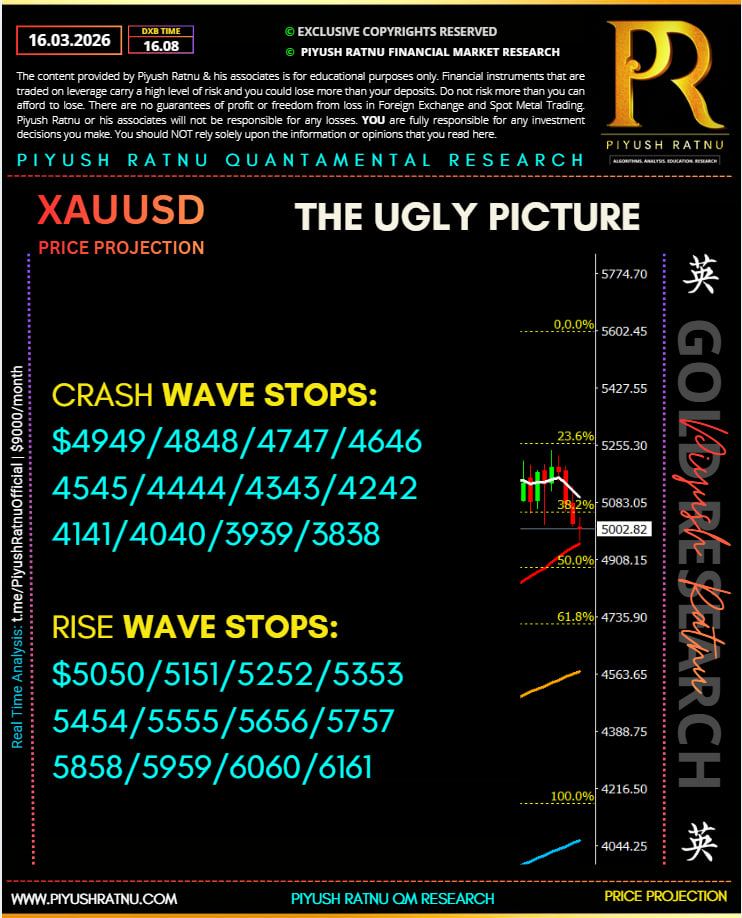
| 4880–4930 | Heavy distribution (sell zone) |
| 4830 | Breakdown trigger |
| 4750 | Liquidity pocket |
| 4700–4680 | Stop-hunt + accumulation |
| 4620 | Extreme panic level |
Key Insight
Gold reacts to macro cycles, not calendar dates.
2021 → yields ↑ → gold ↓
2022–2024 → crisis + rate cuts → gold ↑
2026 → hawkish Fed → gold ↓
Critical Levels to Watch
| Level | Action |
|---|---|
| 4830 | Trend reversal trigger |
| 4800 | Bounce target |
| 4700 | Reaction zone |
| 4620 | Last support |
⏱ 12-Hour Market Behavior Model
| Time Window | Expected Behavior | Probability |
|---|---|---|
| 0–2 hrs | Volatility spike / stop hunt | 90% |
| 2–4 hrs | Sharp bounce attempt | 70% |
| 4–8 hrs | Pullback / consolidation | 60% |
| 8–12 hrs | Direction confirmation | 75% |
18.03.2026 | 21.35 PM
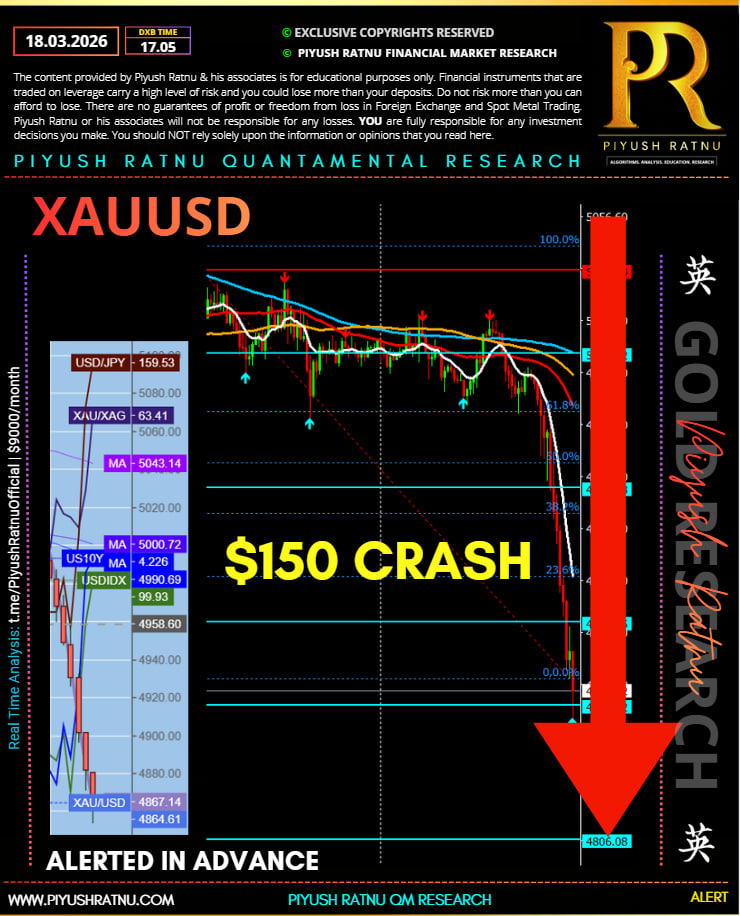
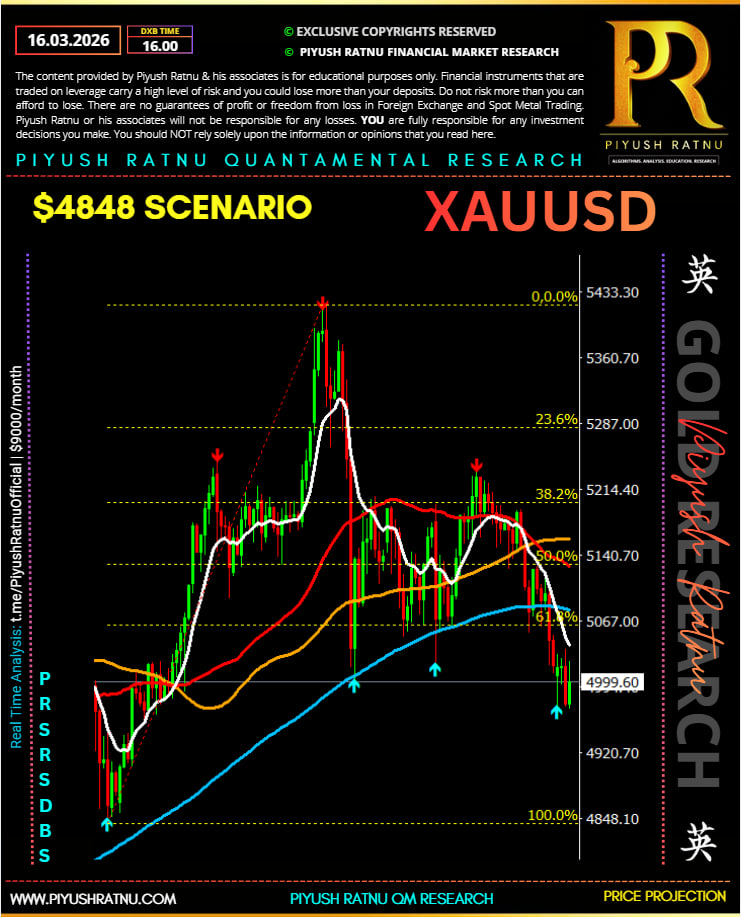
Gold Market Analysis: Hawkish Policy Expectations and Inflation Shock Pressure XAU/USD to $4848 zone as projected by Piyush Ratnu Gold Market Research at 10.45 AM today.
| Analytical Segment | Macroeconomic Interpretation |
|---|---|
| Price Action and Trend Continuation | Gold experienced a sharp depreciation of approximately 3.4% during Wednesday’s session, extending the broader corrective sequence initiated from the $5,419 peak recorded on March 2. The preceding two sessions produced consecutive daily Doji formations, indicating a temporary equilibrium between buyers and sellers above the $5,000 psychological threshold. |
| Technical Breakdown and Structural Shift | The decisive breach of the $5,000 pivot triggered a rapid downside acceleration, slicing through the daily cloud structure spanning $5,000–$4,870 and ultimately reaching $4,834, the lowest level since early February. This breakdown represents a material deterioration in near-term market structure, shifting the tactical bias toward further downside exploration as key technical support levels have been invalidated. |
| Monetary Policy Expectations and Real Yield Dynamics | The primary catalyst behind the selloff stems from intensifying expectations that policymakers at the Federal Reserve may adopt a more hawkish tone during the ongoing Federal Open Market Committee meeting. Elevated inflation expectations—driven partly by geopolitical disruptions—have reinforced the “higher-for-longer” interest-rate narrative, strengthening US real yields and consequently increasing the opportunity cost of holding non-yielding assets such as gold. |
| Inflation Data Shock and Market Reaction | Downward pressure intensified following the release of US Producer Price Index (PPI) data, which revealed a 3.4% year-on-year increase for February, surpassing both market expectations and the prior 2.9% reading. The core PPI accelerated to 3.9%, while the monthly figure surged 0.7% versus the expected 0.3%. This upside inflation surprise reinforced fears that price pressures were already building before the escalation of Middle East tensions, thereby strengthening the case for tighter monetary policy. |
| Geopolitical Energy Shock Transmission | Escalating hostilities involving Iran and Israel have significantly disrupted the global energy supply chain, particularly through tensions surrounding the Strait of Hormuz, a critical maritime corridor for Persian Gulf crude exports. Supply interruptions have driven crude prices sharply higher, intensifying concerns about cost-push inflation across global economies and complicating the policy calculus for central banks. |
| Risk Sentiment and Dollar Strength | Financial markets responded to the inflation surprise and geopolitical escalation with a pronounced risk-off rotation. US equities declined sharply as investors reassessed growth and inflation dynamics, while safe-haven flows favored the US Dollar, exerting additional downward pressure on dollar-denominated commodities such as gold. |
| Policy Outlook and Market Focus | Despite the heightened volatility, the consensus expectation remains that the Federal Reserve will maintain its policy rate within the 3.50%–3.75% corridor. Market participants are primarily focused on policymakers’ forward guidance regarding how the Iran-related energy shock may affect future inflation trajectories and monetary policy normalization. Political pressure has also intensified, with comments from Donald Trump publicly questioning the timing of potential rate cuts by Fed Chair Jerome Powell. |
Macro Correlation Matrix
| Macro Variable | Direction Observed | Impact on Gold (XAU/USD) | Transmission Mechanism |
|---|---|---|---|
| US PPI Inflation | Rising | Bearish | Higher inflation → higher real yields expectations |
| US Dollar | Strengthening | Bearish | Strong USD increases gold’s opportunity cost |
| Oil Prices | Rising | Mixed | Inflation hedge vs tighter policy expectations |
| US Equities | Falling | Mixed | Risk-off supports gold but USD strength offsets |
| Fed Policy Expectations | Hawkish shift | Bearish | Higher rates suppress non-yielding assets |
Technical Positioning After Breakdown
| Key Level | Role |
|---|---|
| $5,000 | Major broken support / now resistance |
| $4,870 | Lower boundary of Ichimoku cloud |
| $4,834 | Latest one-month low |
| $4,800 | Next structural support |
| $4,700 | Medium-term downside target |
Professional Market Summary
Gold’s sharp decline reflects a confluence of macroeconomic forces rather than a purely technical breakdown. Elevated US producer inflation, coupled with energy-driven price pressures arising from Middle East geopolitical tensions, has reinforced expectations that the Federal Reserve may maintain a restrictive monetary stance for longer than previously anticipated. This shift has strengthened the US Dollar and real yields, both historically negative drivers for bullion.
While technical indicators suggest short-term oversold conditions that could trigger temporary consolidation, the structural bias remains tilted to the downside as long as gold trades below the $5,000 pivot, with further downside risk toward $4,800–$4,700 should hawkish policy signals materialize from the Fed.
18.03.2025 | 10.45 AM
Gold Price Outlook: Fed Policy Risk Dominates as XAU/USD Tests Structural Support | $4848 or $5151: Post FOMC?
| Section | Analysis |
|---|---|
| Market Positioning Ahead of FOMC | Gold (XAU/USD) is trading defensively around the $5,000 psychological threshold, hovering near its weakest level in a month as markets enter a high-volatility event window ahead of the Federal Reserve policy announcement. The precious metal remains range-bound as investors refrain from aggressive positioning before clarity emerges on the Fed’s forward policy guidance and rate trajectory. |
| Macro Drivers: War-Induced Inflation vs Monetary Tightness | From a macroeconomic perspective, the prolonged Middle East conflict continues to sustain elevated crude oil prices, reinforcing inflation persistence risks across developed economies. This dynamic strengthens expectations of a more restrictive monetary stance from the Federal Reserve, which structurally undermines demand for non-yielding assets such as gold. Higher real yields and tighter financial conditions historically exert downward pressure on bullion prices. |
| US Dollar Dynamics and Short-Term Cushion for Gold | Despite the broader hawkish macro backdrop, the US Dollar Index (DXY) has paused its recent rally after reaching ten-month highs, as traders engage in tactical profit-taking on long-USD positions ahead of the Fed decision. This temporary retracement in the dollar has limited further downside in gold, preventing a decisive break below key technical support levels. |
| Key Policy Signals Investors Are Monitoring | While the Fed is widely expected to maintain the benchmark rate within the 3.50%–3.75% corridor, the market’s primary focus lies on the 2026 rate trajectory reflected in the Dot Plot, alongside Chairman Jerome Powell’s communication tone during the press conference. Any upward revision to inflation projections or downward revision to growth forecasts would reinforce the “higher-for-longer” interest-rate narrative, strengthening the dollar and weighing on precious metals. |
| Event Risk Catalysts Before the Fed Decision | In the immediate pre-FOMC window, gold price action may temporarily respond to US Producer Price Index (PPI) data, which serves as a leading indicator of pipeline inflation pressures. Additionally, geopolitical headlines from the Middle East conflict could continue injecting volatility into energy markets, indirectly influencing gold through the inflation channel. |
| Technical Structure and Momentum Bias | From a technical standpoint, gold remains vulnerable as momentum oscillators indicate weakening bullish momentum. The Relative Strength Index (RSI) remains below the neutral 50 threshold, signalling fading buying pressure. A decisive break below the 50-day Simple Moving Average (SMA) at $4,976 could trigger algorithmic selling flows and accelerate downside momentum toward deeper support zones. |
FOMC Scenario Matrix and Quantified Market Reactions
| Fed Outcome Scenario | Policy Signal | USD Reaction | Equities Reaction | Gold Reaction (XAU/USD) | Probability Estimate |
|---|---|---|---|---|---|
| Dovish Pivot | Dot plot signals 2 rate cuts in 2026 | USD weakens sharply | Global equities rally | Gold rallies strongly | 30% |
| Neutral / Base Case | 1 rate cut projected, similar outlook | Mild USD weakness | Limited equity upside | Gold consolidates near $5,000 | 45% |
| Hawkish Surprise | Less than 1 cut projected | USD rallies aggressively | Risk assets fall | Gold breaks key support | 25% |
FOMC Quantified Trading Framework for XAU/USD
| Technical Level | Trigger Condition | Trade Bias | Entry Zone | Target Zone | Probability |
|---|---|---|---|---|---|
| $5,050 – $5,080 | Dovish Fed / USD breakdown | Buy breakout | Above $5,050 | $5,150 – $5,220 | 35% |
| $5,000 Pivot Zone | Neutral Fed guidance | Range trade | $4,990 – $5,010 | $5,060 / $4,960 | 40% |
| $4,976 (50-day SMA) | Hawkish surprise | Sell breakdown | Below $4,970 | $4,900 – $4,840 | 25% |
Cross-Asset Transmission Model
| Macro Variable | Direction Impacting Gold | Transmission Mechanism |
|---|---|---|
| US Dollar Index (DXY) | Negative correlation | Stronger USD increases gold’s opportunity cost |
| US 10Y Real Yields | Strong inverse correlation | Rising real yields reduce gold demand |
| Crude Oil Prices | Positive correlation | Higher oil → inflation risk → gold hedge demand |
| Geopolitical Risk Index | Positive correlation | Safe-haven flows increase bullion demand |
| Equity Market Volatility (VIX) | Positive correlation | Risk-off sentiment boosts gold |
✅ Strategic Summary
-
The $4,976 level (50-day SMA) represents the critical inflection point.
-
A hawkish Fed surprise could trigger a structural downside break, potentially extending toward $4,900–$4,840.
-
Conversely, a dovish pivot or softer tone from Powell could rapidly reprice gold toward $5,150+ as real yields retreat.
FOMC Reaction MAP for XAUUSD
Below is a last-10 completed FOMC reaction map for spot Gold (XAU/USD) going into today’s March 18, 2026 FOMC. I’m using the same-day post-decision / late-session spot-gold move cited in Reuters coverage, so these are best read as event-day reaction magnitudes, not strict close-to-close returns.
| FOMC date | Fed takeaway | XAU/USD reaction | Read-through |
|---|
| Jan 28, 2026 | Fed held at 3.50%-3.75%; statement gave little clarity on cuts | +4.0% | Gold largely ignored the hold and exploded higher on broader uncertainty/safe-haven demand. |
| Dec 10, 2025 | 25 bp cut; median leaned to only one cut in 2026 | +0.7% | Dovish on the day, but upside was moderated by uncertainty around the 2026 path. |
| Oct 29, 2025 | 25 bp cut; Powell cast doubt on December follow-through | +0.3% | Initial rally faded as Powell’s caution turned the message less dovish than the headline cut implied. |
| Sep 17, 2025 | 25 bp cut; “meeting-by-meeting” tone | -0.9% | Gold sold off despite the cut because Powell framed it as risk-management rather than the start of an aggressive easing cycle. |
| Jul 30, 2025 | Fed held at 4.25%-4.50%; no signal that cuts were near | -1.5% | Hawkish hold plus firm US data lifted the dollar and hit bullion. |
| Jun 18, 2025 | Fed held; slower outer-year easing path, Powell warned on inflation | -0.4% | Gold initially blipped higher, then reversed as Powell cooled dovish hopes. |
| May 7, 2025 | Fed held; “wait and see” tone | -1.8% | One of the clearer hawkish disappointments for gold in the sample. |
| Mar 19, 2025 | Fed held; signaled two cuts by year-end | +0.5% | Classic dovish-hold reaction: lower real-rate expectations helped gold break to record highs. |
| Jan 29, 2025 | Fed held; little clarity on timing of next cuts | -0.4% | Mildly hawkish hold; dollar and yields rose. |
| Dec 18, 2024 | 25 bp cut, but Fed signaled slower 2025 easing | -2.1% | The most hawkish cut in the sample; gold was hit hard by higher yields and a stronger dollar. |
Expected move for today’s FOMC
Using those 10 event-day absolute reactions, the distribution looks like this:
| Metric | Historical reading | Implied move from $4,984.29 |
|---|---|---|
| Average absolute move | 1.26% | about $63 |
| Median absolute move | 0.80% | about $40 |
| Upper-quartile / strong reaction | ~1.8% | about $90 |
| Tail event | 4.0% | about $199 |
Practical FOMC map for tonight | CMP $5015 XAUUSD
| Scenario | Likely gold response |
|---|---|
| Dovish hold: dot plot still shows meaningful easing, Powell sounds relaxed on inflation | +$60 to +$90 first response; squeeze risk higher if DXY and real yields both fall. |
| Neutral / muddled hold: no big dot-plot shock, Powell stays data-dependent | roughly ±$69 chop; whipsaw risk high. |
| Hawkish surprise: fewer cuts, stronger inflation concern, Powell pushes back on easing | -$69 to -$111 is the cleaner base case; a true shock can stretch toward -$169 to -$188. |
a true macro shock can produce a much larger burst. With spot gold around $4,984, a reasonable event envelope is:
-
Base band: $4,949 to $5,050
-
Strong reaction band: $4,885 to $5,085
-
Tail band: $4,769 to $5,185
FOMC Day Trading Map – XAU/USD (Event Strategy)
Current reference price: ~$5,000
Event: Federal Reserve FOMC policy decision & press conference by Jerome Powell
Historical FOMC expected move: $40–$65 average, $90 strong move, $150+ tail shock
Event Volatility Framework
| Metric | Value | Price Projection from $5,000 |
|---|---|---|
| Average FOMC move | 1.2% | ≈ $60 |
| Median move | 0.8% | ≈ $40 |
| Strong reaction | 1.8% | ≈ $90 |
| Tail shock | 3–4% | ≈ $150–$200 |
Expected volatility envelope today
| Range Type | Price Range |
|---|---|
| Normal reaction | $4,940 – $5,060 |
| Strong reaction | $4,910 – $5,090 |
| Tail shock | $4,800 – $5,200 |
Key Technical Levels (Pre-FOMC Liquidity Zones)
| Level | Significance |
|---|---|
| $5,080 – $5,100 | Major breakout resistance |
| $5,050 | Pre-FOMC liquidity pocket |
| $5,000 | Psychological pivot |
| $4,976 | 50-day SMA support |
| $4,940 | Volatility support |
| $4,900 | Panic liquidity zone |
Quantified FOMC Trading Strategy
| Scenario | Trigger | Entry | Stop Loss | Target 1 | Target 2 | Probability |
|---|---|---|---|---|---|---|
| Dovish Fed breakout | Gold breaks $5,050 | Buy $5,055 | $5,020 | $5,100 | $5,170 | 35% |
| Neutral whipsaw | Gold holds $5,000 | Buy $4,990 | $4,960 | $5,040 | $5,060 | 40% |
| Hawkish Fed selloff | Break $4,976 | Sell $4,970 | $5,010 | $4,920 | $4,880 | 25% |
Powell Tone Reaction Matrix
| Powell Tone | USD Reaction | Bond Yields | Gold Reaction |
|---|---|---|---|
| Dovish | Dollar falls | Real yields drop | Gold rallies |
| Neutral | Dollar sideways | Stable yields | Range trading |
| Hawkish | Dollar rallies | Yields spike | Gold sells off |
Cross-Asset Signal Confirmation
| Asset | Bullish Gold Signal | Bearish Gold Signal |
|---|---|---|
| US Dollar Index | Below 96 | Above 97 |
| US 10Y Real Yield | Falling | Rising |
| Crude Oil | Above $90 | Below $85 |
| Equities (S&P500) | Risk-off | Risk-on |
High-Probability Institutional Play
| Trade Type | Entry Zone | Target | Risk |
|---|---|---|---|
| FOMC breakout long | Above $5,050 | $5,150–$5,200 | Medium |
| FOMC breakdown short | Below $4,976 | $4,900–$4,840 | High |
| Whipsaw scalp | $4,990–$5,010 | $40 range | Low |
Professional Summary
-
Base move: $45–$69
-
Breakout trigger: $5,069
-
Breakdown trigger: $4,949
-
High-probability volatility window: first 30 minutes after Powell speaks
Key Liquidity Pools for Today
| Liquidity Zone | Type | What Institutions Typically Do |
|---|---|---|
| $5,080 – $5,100 | Buy-side liquidity | Trigger breakout stops → then possible reversal |
| $5,050 | Intraday resistance | First breakout trap level |
| $5,000 | Psychological pivot | High-frequency whipsaw zone |
| $4,976 | Major support (50-day SMA) | Sell-stop liquidity pool |
| $4,940 – $4,950 | Panic liquidity | Fast liquidation area |
| $4,900 | Deep liquidity | Institutional accumulation zone |
Classic FOMC Liquidity Trap Pattern
| Phase | Market Behavior | What Smart Money Does |
|---|---|---|
| 1. Pre-FOMC compression | Gold trades in tight range near $5,000 | Liquidity builds on both sides |
| 2. Initial spike | Sudden $30–$60 move | Stops get triggered |
| 3. Liquidity sweep | Price overshoots key level | Retail traders trapped |
| 4. Real move | Direction emerges after Powell speaks | Institutional trend begins |
Most Likely Trap Scenarios
| Scenario | Liquidity Sweep | Final Move |
|---|---|---|
| Fake breakout up | Spike to $5,080–$5,100 | Drop toward $4,950 |
| Fake breakdown | Flush to $4,950–$4,970 | Rally toward $5,080 |
| True trend move | Break $5,100 or $4,940 | Expansion toward $150+ move |
Algorithmic Trigger Levels
| Level | System Reaction |
|---|---|
| Above $5,050 | Momentum algos activate longs |
| Below $4,976 | Systematic funds trigger shorts |
| Below $4,940 | CTA selling acceleration |
| Above $5,100 | Gamma squeeze possible |
High Probability Institutional Trade Setup
| Setup | Entry | Stop | Target | Probability |
|---|---|---|---|---|
| Liquidity sweep buy | $4,950–$4,970 | $4,920 | $5,050 | 40% |
| Liquidity sweep sell | $5,080–$5,100 | $5,130 | $4,980 | 35% |
| Trend breakout | $5,100 breakout | $5,050 | $5,200 | 25% |
Powell Reaction Timing
| Time After Statement | Typical Market Action |
|---|---|
| 0–5 minutes | Violent spike |
| 5–15 minutes | Liquidity sweep |
| 15–30 minutes | Real trend forms |
| 30–90 minutes | Institutional trend continuation |
Statement comes from the Federal Reserve, followed by the press conference from Jerome Powell.
Professional Insight
Most FOMC days follow a “Stop Hunt → Reversal → Trend” sequence.
So the highest probability institutional trade is usually:
Wait for the first spike → trade the reversal after liquidity sweep.
Critical Level Today:
$4,949 — if this breaks with volume, gold could quickly fall toward $4,885–$4,848.
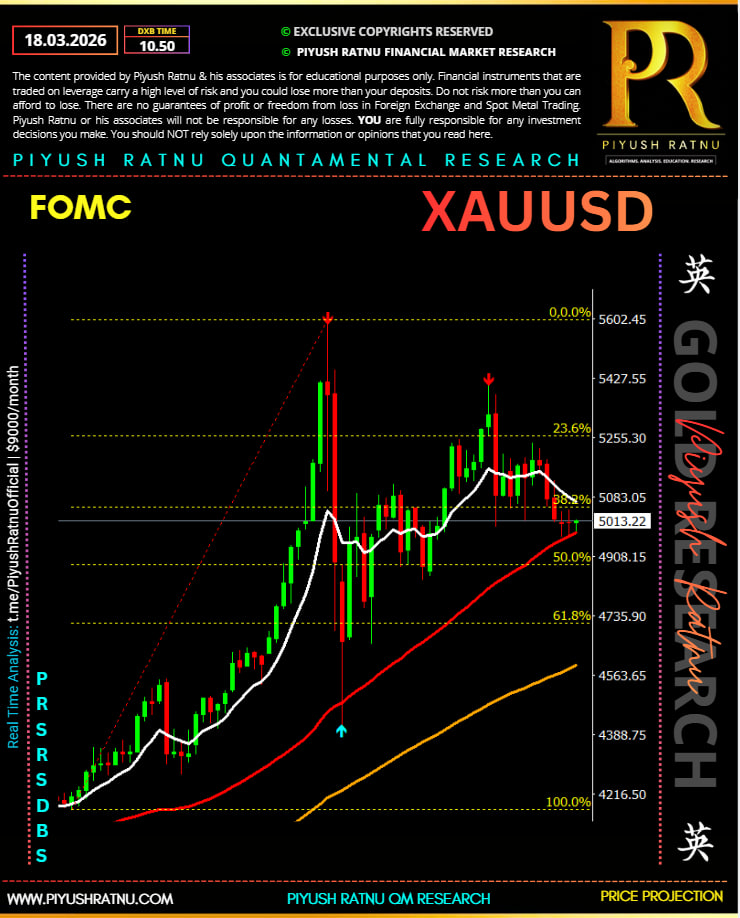
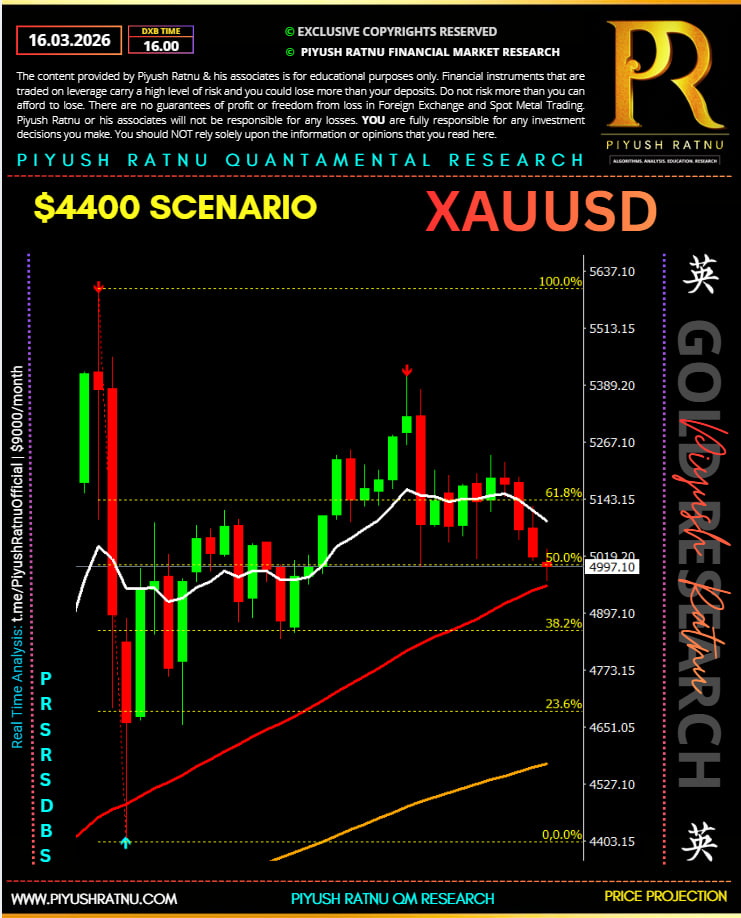
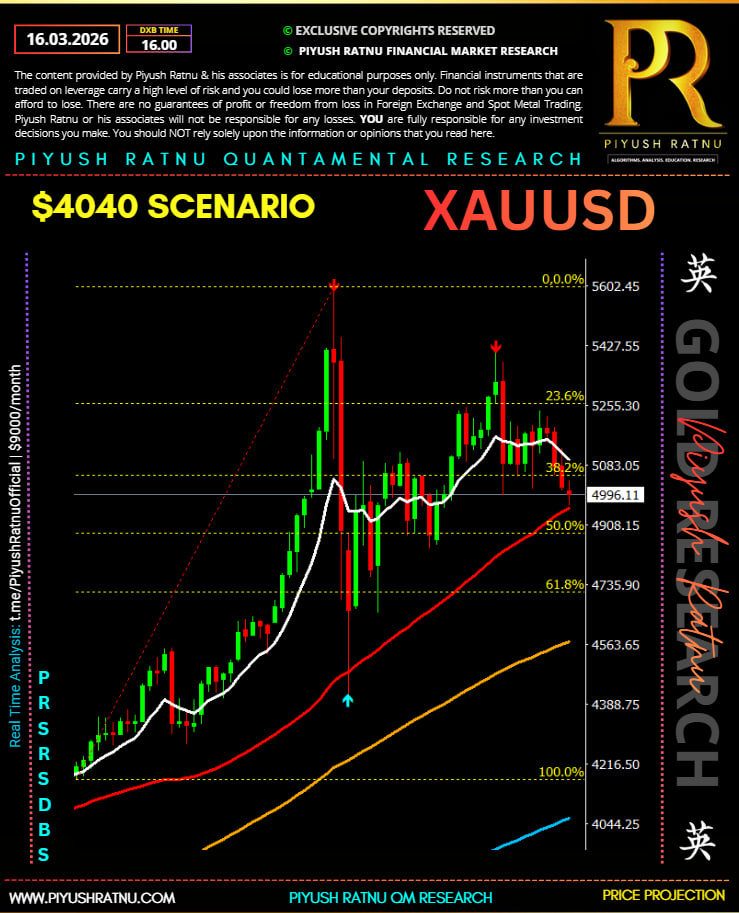
Key observations from the structure:
-
Major impulse: ~4280 → ~5630
-
Current retracement: near 38.2%–50% band
-
Price trading near equilibrium pivot (~5030–5050)
-
Short-term MA (white) turning down while long-term MA (red) remains bullish → macro uptrend / short-term correction
This suggests mean-reversion within a larger bullish structure.
Murray Math Grid Interpretation
| Murray Level | Price Zone | Meaning |
|---|---|---|
| 0/8 | ~4282 | Ultimate support |
| 2/8 | ~4666 | Major reversal zone |
| 4/8 | ~5030 | Major equilibrium / pivot |
| 5/8 | ~5176 | Trend confirmation resistance |
| 6/8 | ~5230 | Strong resistance |
| 8/8 | ~5631 | Extreme overbought |
Current price is hovering near 4/8 Murray line, which statistically acts as fair value equilibrium.
Quantified Trade Scenarios (Murray Math)
| Setup | Entry | Stop | Target 1 | Target 2 | Probability |
|---|---|---|---|---|---|
| Mean reversion long | 5005–4985 | 4935 | 5176 | 5230 | 42% |
| Breakdown short | Below 4980 | 5040 | 4895 | 4806 | 33% |
| Momentum breakout long | Above 5176 | 5100 | 5230 | 5340 | 25% |
Key Liquidity Zones Visible on Chart
| Zone | Role |
|---|---|
| 5230–5250 | Institutional sell zone |
| 5176 | Murray 5/8 pivot |
| 5030 | Major equilibrium |
| 4935–4895 | Buy-side liquidity |
| 4806 | Deep support |
Quantitative Bias
| Metric | Signal |
|---|---|
| Trend (200 MA) | Bullish |
| Momentum (RSI structure) | Neutral / slightly bearish |
| Price vs Murray 4/8 | Mean-reversion zone |
| Volatility compression | Expansion coming |
Directional bias:
➡ Range expansion soon
➡ Higher probability of bounce toward 5176 before deeper correction
Institutional Playbook
Most probable sequence:
1️⃣ Liquidity sweep below 5000
2️⃣ Reversal toward 5176–5230 resistance
3️⃣ Decision zone for larger move
✅ Most Important Level
5030 (Murray 4/8)
If price holds above → trend continuation
If it breaks → correction toward 4895–4806