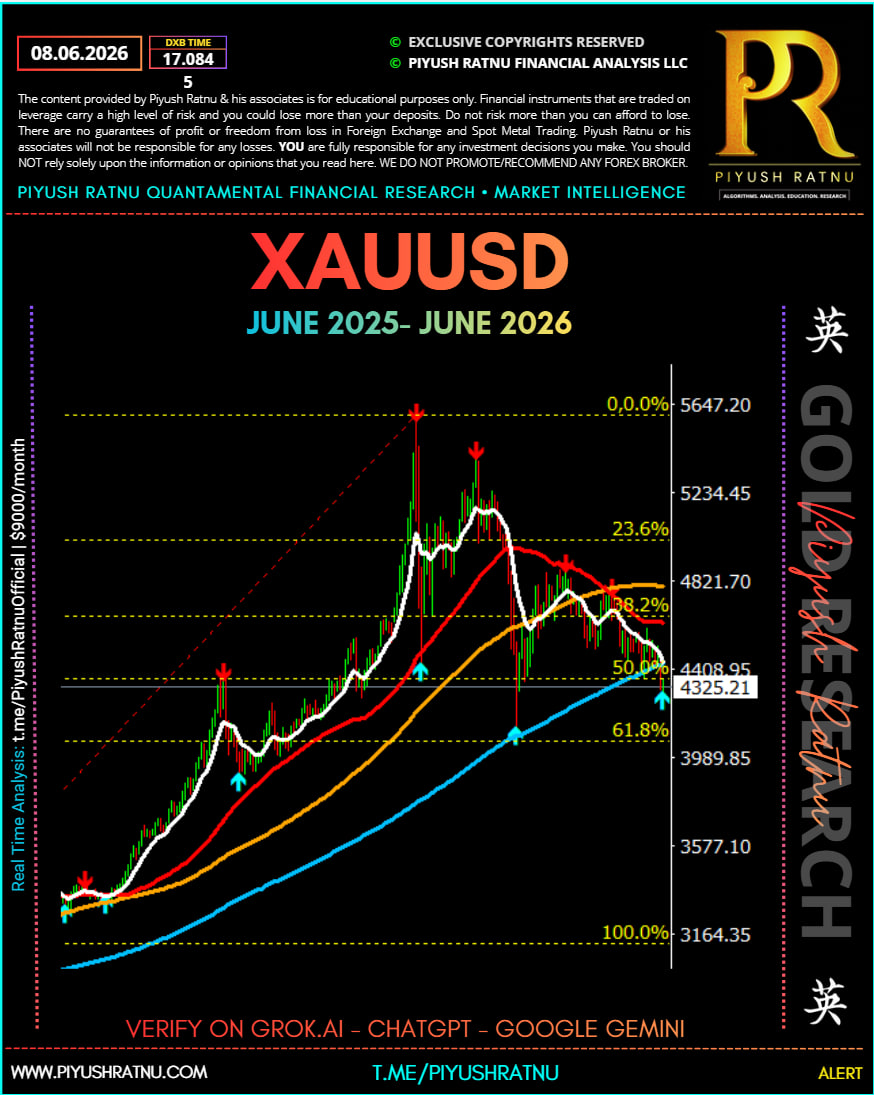
 This chart is very interesting because it shows the entire 2025–2026 XAUUSD super-cycle move, from approximately 3140 → 5662, and the subsequent correction back toward 4290.
Long-Term Structure
Retracement%=High−LowHigh−Base×100Retracement\% = \frac{High-Low}{High-Base}\times100
- Major Base: 3140
- Major Peak: 5662
- Total Bull Run: +2522 points
- Current Price: 4290
- Current Retracement: approximately 54% of the entire rally
The market has already retraced more than a standard Fibonacci 50% correction.
May 2025
Price Zone
- Low: ~3140–3250
- High: ~3350
What Happened
The chart shows a prolonged accumulation phase.
Characteristics:
✅ Price above long-term trend line
✅ Repeated support bounces
✅ Multiple buy signals
✅ No meaningful breakdowns
This was the early institutional accumulation stage.
Pattern
Base Building / Accumulation
3140 → 3250 → 3200
       ↑
   Higher Low
This period resembles smart-money positioning before the explosive rally that followed.
June 2025
Price Zone
Approximately:
- Low: 3250
- High: 3400+
What Happened
Trend strength increased significantly.
The moving averages aligned bullishly:
- White MA > Red MA
- Red MA > Yellow MA
- Yellow MA > Blue MA
A classic trend expansion phase.
Pattern
Trend Initiation
Higher High
Higher Low
Higher High
The market transitioned from accumulation into markup.
July 2025
Price Zone
Approximately:
- 3300 → 3600+
What Happened
The strongest acceleration phase started.
Price moved almost vertically.
Characteristics:
✅ Strong momentum
✅ No deep pullbacks
✅ Moving averages acting as dynamic support
Pattern
Momentum Expansion
Typical pullbacks:
- 5–8%
- Quickly bought
This is often seen in parabolic commodity trends.
August–September 2025
Major Event
Price surged toward:
4300+
The first major top formed.
You can see a red sell signal near the local high.
Retracement
4300
 ↓
3900
Correction:
~9–10%
Pattern
First Major Profit Taking
Healthy correction.
Trend remained bullish.
October–December 2025
Recovery Phase
Price resumed upward:
3900
 ↓
4400
 ↓
4300
 ↓
4600
Characteristics:
- Higher highs
- Higher lows
- Trend integrity maintained
This was one of the strongest trend-confirmation periods.
January 2026
Blow-Off Top
Price exploded:
4900
↓
5662
This is the largest impulse move on the chart.
Pattern
Parabolic Climax
Signs visible:
- Vertical rise
- Distance from moving averages
- Extremely steep angle
These usually precede violent corrections.
February 2026
Crash Phase
Price:
5662
↓
4900
Loss:
~760 points
Retracement
Approximately:
13–14%
This was the first warning sign.
March 2026
Secondary Rally
Price rebounded:
4900
↓
5410
But failed to make a new high.
Pattern
Lower High
Very important.
5662 High
5410 Lower High
This is the first major bearish signal on the chart.
April 2026
Breakdown
Price:
5410
↓
4650
The red MA rolled over.
The trend structure changed.
Pattern
Trend Reversal
The market started producing:
- Lower Highs
- Lower Lows
for the first time since 2025.
May 2026
This is the key month.
Price Levels
Approximately:
4900
↓
4399
Loss:
~500 points
What Happened
The market broke:
- 23.6% Fib
- 38.2% Fib
and headed directly toward the 50% retracement.
Pattern
Waterfall Decline
Characteristics:
- Sharp red candles
- Failed rallies
- Continuous selling pressure
This was the transition from correction into bearish trend.
June 2026 (Current)
Price Levels
Current:
4290
Exactly near:
50% Fibonacci Retracement
Why This Matters
The entire rally:
3140 → 5662has a 50% retracement zone near:
4400–4300
Price is now testing this level.
Historical Retracement Comparison
| Period | Decline |
|---|---|
| Aug 2025 | ~10% |
| Feb 2026 | ~14% |
| Apr-May 2026 | ~22% |
| Peak to Current | ~24% |
This is the largest correction visible on the chart.
What the Chart Suggests Now
Bullish Case (60%)
Support holds:
4242
↓
4393
↓
4444
↓
4653
This would resemble the September 2025 correction where price bounced strongly from support.
Bearish Case (40%)
Support fails:
4290
↓
4242
↓
4148
↓
4000
The 61.8% retracement becomes the next magnet.
Key Observation
The biggest clue on this chart is not the current price.
It is the sequence:
5662 High
5410 Lower High
4900 Lower High
4650 Lower High
The market has been producing a series of lower highs since January 2026.
That confirms the long-term uptrend has weakened substantially.
However, the current 4290–4242 zone is the strongest support area on the entire chart since the January 2026 peak, making it a logical area for at least a technical rebound during the next 1–3 weeks before the market decides whether the correction is complete or extends toward 4148–4000.