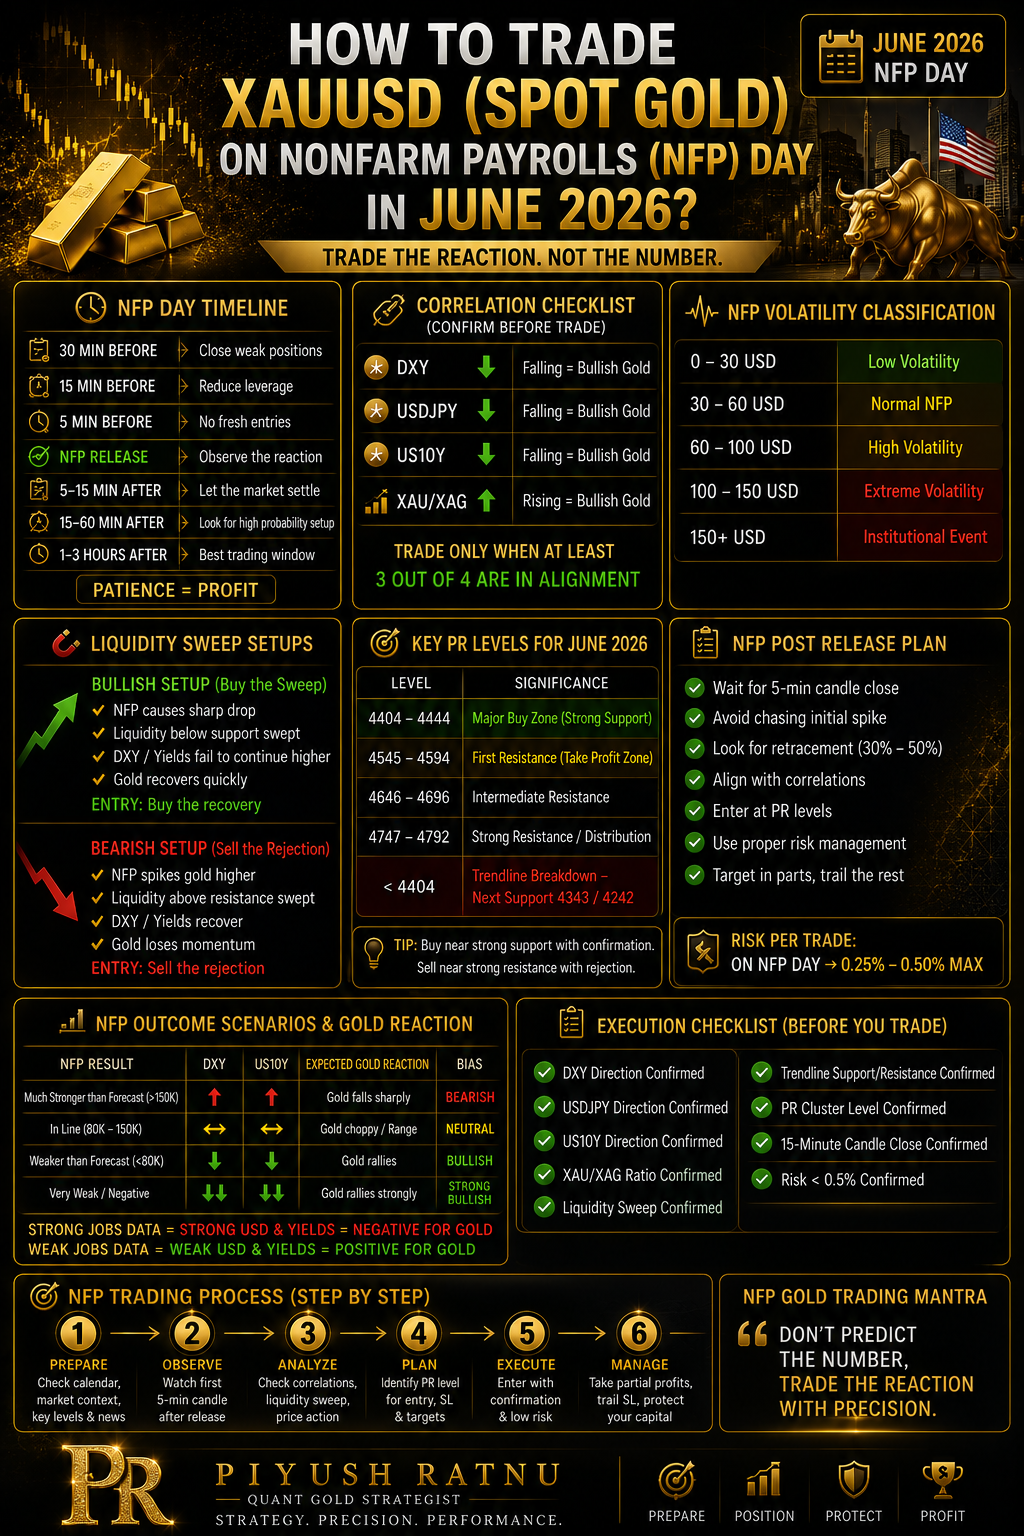
How to trade XAUUSD Spot Gold on NonFarm Payrolls NFP Day in June 2026?
Key Points: How to Trade XAUUSD Spot Gold on NFP Day (June 2026)
1. Trade the Reaction, Not the Number
- Focus on market reaction after NFP.
- Avoid predicting the payroll figure.
2. Follow the 4 Core Correlations
- DXY
- USDJPY
- US10Y Yield
- XAU/XAG Ratio
3. Wait Before Entering
- No fresh trades 5 minutes before NFP.
- Let the first spike settle.
4. Observe the First 5–15 Minute Candles
- Wait for confirmation.
- Avoid chasing volatility.
5. Look for Liquidity Sweeps
- Buy after downside liquidity grabs.
- Sell after upside liquidity grabs.
6. Trade Only When Correlations Align
- Minimum 3 of 4 correlations must support the trade.
7. Use Key PR Levels
- 4404–4444 → Major Buy Zone
- 4545–4594 → First Resistance
- 4747–4792 → Distribution Zone
8. Monitor NFP Volatility
- $0–30 = Low
- $30–60 = Normal
- $60–100 = High
- $100+ = Extreme
9. Risk Management First
- Risk only 0.25%–0.50% per trade.
- Protect capital during high volatility.
10. Use the NFP Execution Checklist
- DXY Confirmed
- USDJPY Confirmed
- US10Y Confirmed
- XAU/XAG Confirmed
- Liquidity Sweep Confirmed
- Trendline Confirmed
- PR Level Confirmed
- 15-Min Candle Confirmed
11. Follow the 6-Step Process
- Prepare
- Observe
- Analyze
- Plan
- Execute
- Manage
12. Strong NFP = Bearish Gold
- Strong jobs data boosts USD and yields.
- Usually pressures Gold lower.
13. Weak NFP = Bullish Gold
- Weak jobs data weakens USD and yields.
- Usually supports Gold higher.
14. Buy Support, Sell Resistance
- Buy near strong support after confirmation.
- Sell near resistance after rejection.
15. Probability = Correlations + Liquidity + Patience
- High-probability trades require alignment of all factors.
PR NFP Mantra
“Don’t Predict. Prepare. Observe. Execute with Precision.”
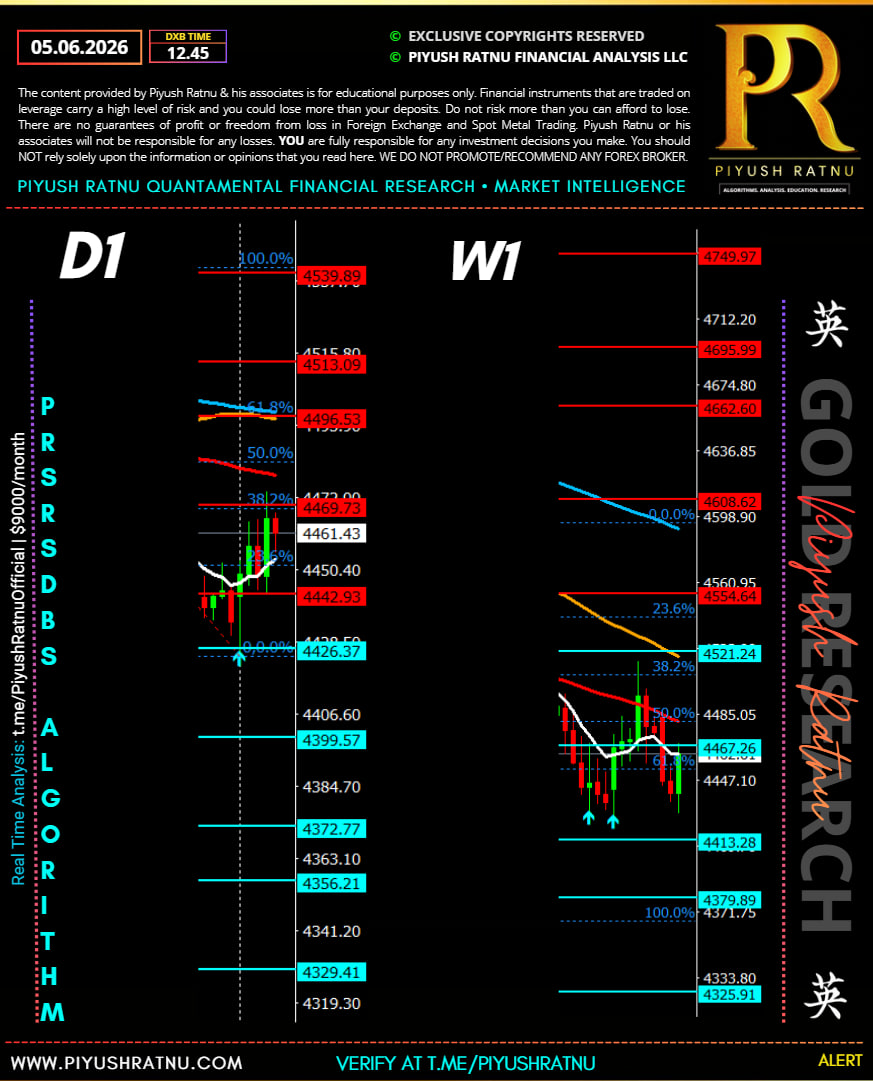
XAUUSD Technical & Correlation Analysis
Current Market Structure
The first chart shows XAUUSD trading near 4430–4460, sitting directly on a major long-term ascending trendline and attempting to stabilize after a significant correction from the 5588 high.
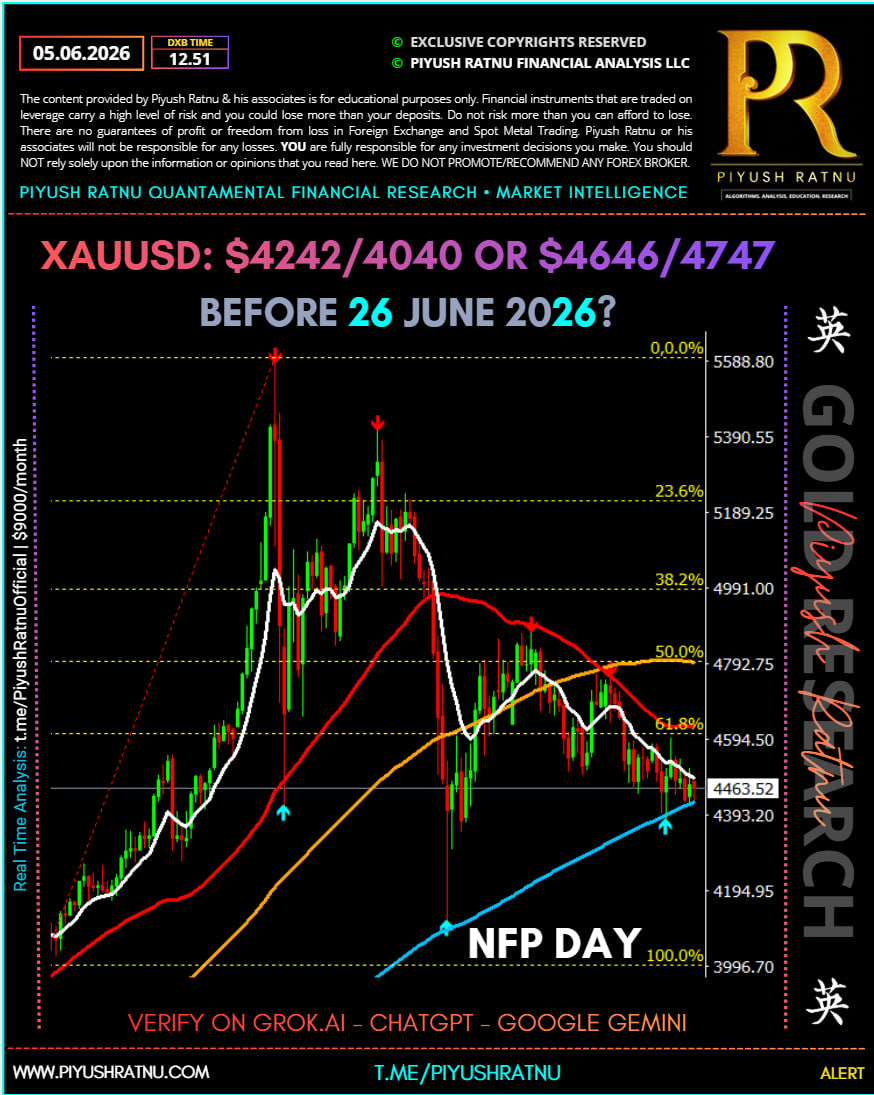 Key Technical Levels
| Level | Significance |
|---|---|
| 5588 | Major Swing High |
| 5189 | 23.6% Fibonacci |
| 4991 | 38.2% Fibonacci |
| 4792 | 50% Fibonacci |
| 4594 | 61.8% Fibonacci |
| 4444-4404 | PR Quant Buying Zone |
| 3996 | Major Swing Low |
Technical Summary
Bullish Factors
✅ Long-term blue trendline remains intact.
✅ Multiple historical bounces from trendline support.
✅ Price holding near major institutional demand zone.
✅ Current structure resembles a higher-low formation.
✅ Risk-reward favors buyers near support rather than sellers.
Bearish Factors
❌ Price remains below 50 EMA.
❌ Price remains below 100 EMA.
❌ EMA alignment remains bearish.
❌ Recovery rallies continue to face resistance.
Correlation Dashboard Analysis
The second chart provides important intermarket confirmation.
USDJPY = 159.95
Impact on Gold: Bearish
Historically:
- Rising USDJPY = Stronger USD / weaker JPY
- Indicates risk-on sentiment
- Usually negative for Gold
Current reading near 160.00 suggests the market is still favoring USD strength.
Gold Impact: -1
DXY = 99.25
Impact on Gold: Neutral to Slightly Bullish
DXY below 100 remains supportive for Gold.
A sustained break below 99 would likely fuel another rally.
Current positioning:
- Not aggressively bullish
- Not strongly bearish
Gold Impact: +0.5
US10Y Treasury Yield = 4.467%
Impact on Gold: Bearish
Higher yields increase the opportunity cost of holding Gold.
Current yield remains elevated.
For Gold to accelerate higher, ideally:
- US10Y should fall below 4.30%
- Preferably below 4.20%
Current yield remains a headwind.
Gold Impact: -1
XAU/XAG Ratio = 61.48
Impact on Gold: Bullish
A rising Gold/Silver ratio often indicates:
- Defensive positioning
- Safe-haven demand
- Institutional caution
This generally favors Gold over risk assets.
Gold Impact: +1
Moving Average Analysis
MA 4482
Immediate resistance.
Current price is trading just below it.
A break above would trigger short-covering.
MA 4519
Major resistance zone.
This aligns with:
- Previous structure
- EMA cluster
- Institutional supply
MA 4592
Critical reversal level.
A daily close above this area would likely confirm the correction is ending.
Correlation Scorecard
| Factor | Reading | Gold Impact |
|---|---|---|
| USDJPY | 159.95 | Bearish |
| DXY | 99.25 | Slight Bullish |
| US10Y | 4.467% | Bearish |
| XAU/XAG | 61.48 | Bullish |
| Trendline Support | Holding | Bullish |
| EMA Structure | Bearish | Bearish |
Overall Score
Bullish Factors: 3
Bearish Factors: 3
Current market condition:
Neutral → Bullish Bias
The market is sitting at a major support zone while correlations remain mixed.
 Piyush Ratnu Quant Interpretation
Bullish Trigger
If:
- DXY falls below 99
- USDJPY weakens below 158
- US10Y drops below 4.30%
Then XAUUSD can target:
4545 → 4594 → 4747 → 4792
Bearish Trigger
If:
- USDJPY breaks above 160.50
- US10Y rises above 4.60%
- DXY reclaims 100+
Then XAUUSD may revisit:
4404 → 4343 → 4242 → 3996
Final Verdict
Short-Term (1–2 Weeks)
Neutral to Slightly Bullish
Support:
4404–4444
Resistance:
4482–4519
Medium-Term (1–3 Months)
Bullish Above 4404
Target Zones:
🎯 4545
🎯 4594
🎯 4747
🎯 4792
🎯 4991
The technical structure suggests that Gold is attempting to build a base around the 4444–4404 PR Quant Buying Zone, but confirmation requires a decisive move above 4519–4594 and supportive shifts in USDJPY, DXY, and US10Y correlations. The trendline remains the most important level on the chart; as long as it holds, the broader bullish structure remains alive.
Gold Performance in June & NFP Impact (Last 5 Years)
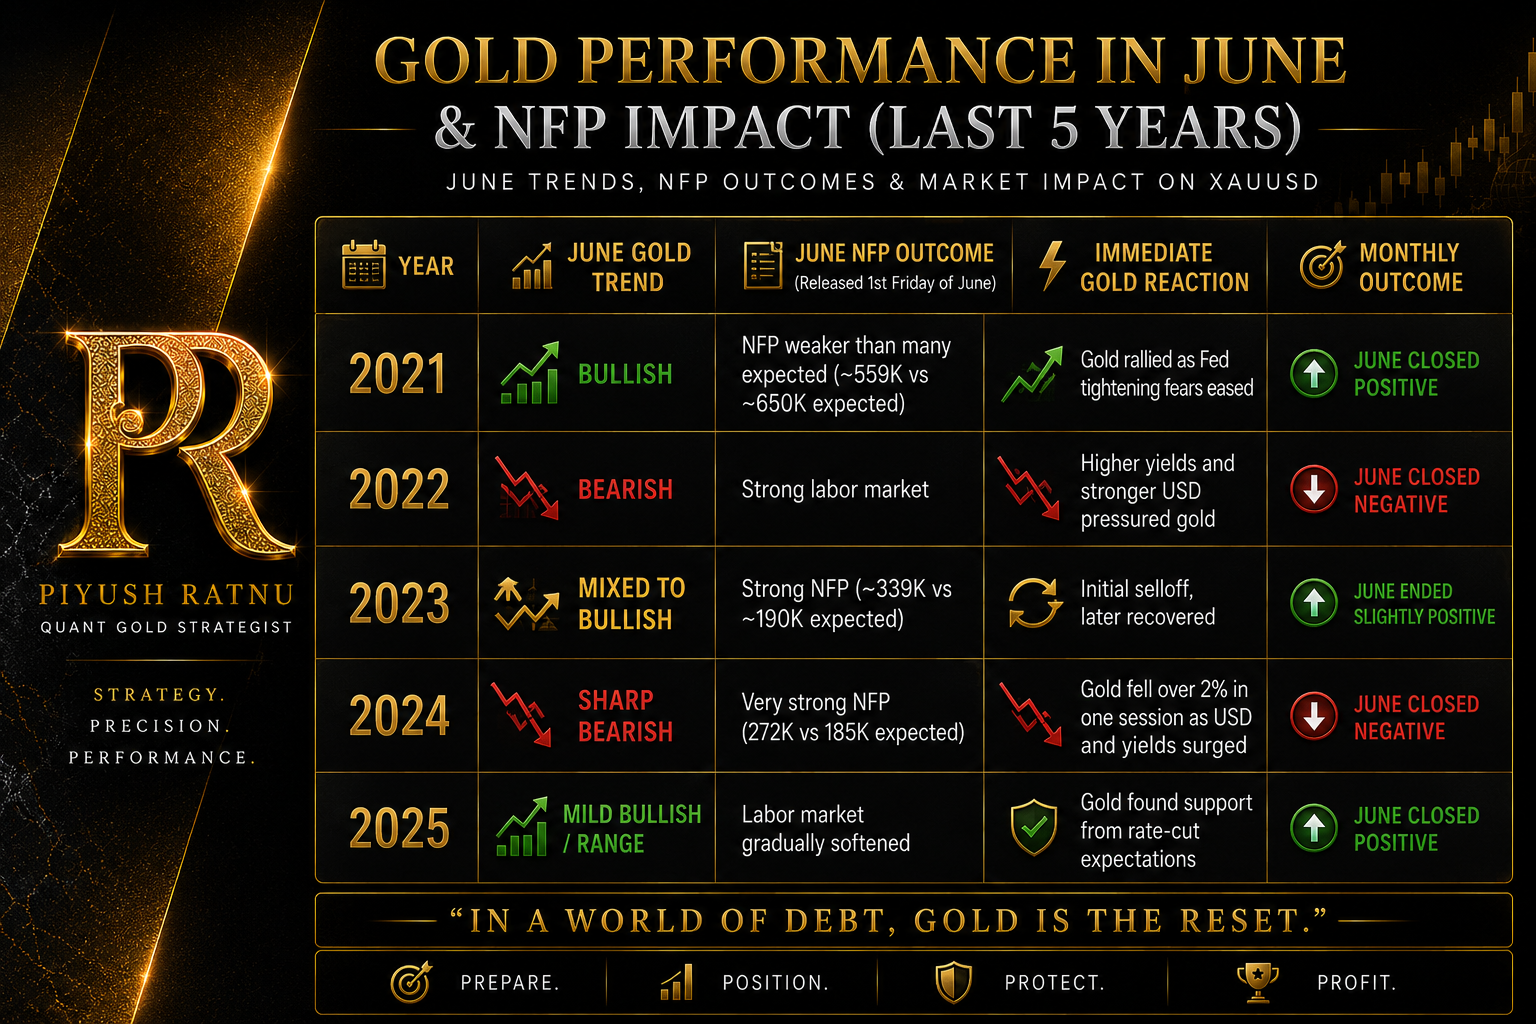 The table below summarizes the general June trend for Gold (XAUUSD), the June NFP outcome (released on the first Friday of June and reflecting May employment), and the immediate market impact.
| Year | June Gold Trend | June NFP Outcome | Immediate Gold Reaction | Monthly Outcome |
|---|---|---|---|---|
| 2021 | Bullish | NFP weaker than many expected (~559K vs ~650K expected) | Gold rallied as Fed tightening fears eased | June closed positive |
| 2022 | Bearish | Strong labor market | Higher yields and stronger USD pressured gold | June closed negative |
| 2023 | Mixed to Bullish | Strong NFP (~339K vs ~190K expected) | Initial selloff, later recovered | June ended slightly positive |
| 2024 | Sharp Bearish | Very strong NFP (272K vs 185K expected) | Gold fell over 2% in one session as USD and yields surged | June closed negative |
| 2025 | Mild Bullish / Range | Labor market gradually softened | Gold found support from rate-cut expectations | June closed positive |
NFP Impact on Gold (Historical Pattern)
| NFP Result | USD | US10Y Yield | Gold Impact |
|---|---|---|---|
| Much Stronger than Forecast | ↑ | ↑ | Bearish |
| Slightly Stronger | ↑ | Neutral | Slight Bearish |
| In Line | Neutral | Neutral | Technical reaction only |
| Slightly Weaker | ↓ | ↓ | Bullish |
| Much Weaker | ↓↓ | ↓↓ | Strong Bullish |
NFP and Gold remain generally negatively correlated because stronger employment data tends to support the US Dollar and Treasury yields, increasing the opportunity cost of holding gold.
June Seasonality (2021–2025)
| Year | June Outcome |
|---|---|
| 2021 | ▲ Bullish |
| 2022 | ▼ Bearish |
| 2023 | ▲ Slight Bullish |
| 2024 | ▼ Bearish |
| 2025 | ▲ Mild Bullish |
Summary
- Bullish Junes: 3 out of 5 years (60%)
- Bearish Junes: 2 out of 5 years (40%)
- June historically has a slight bullish bias, but NFP often determines the first major directional move of the month.
- The strongest negative June NFP reaction occurred in 2024, when gold dropped more than 2% after payrolls significantly beat expectations.
PR Quant Analysis
Current correlation snapshot from your dashboard:
| Factor | Current Reading | Gold Bias |
|---|---|---|
| USDJPY | 159.95 | Bearish |
| DXY | 99.25 | Slight Bullish |
| US10Y | 4.467% | Bearish |
| XAU/XAG | 61.48 | Bullish |
June 2026 NFP Scenarios
| Scenario | Expected Gold Reaction | PR Levels |
|---|---|---|
| NFP > 150K | Bearish | 4404 → 4343 |
| NFP 80K–150K | Neutral | 4404–4545 Range |
| NFP < 80K | Bullish | 4545 → 4594 |
| NFP Negative / Major Miss | Strong Bullish | 4747 → 4792 |
PR Quant Verdict
Support Zone: 4444–4404
Major Resistance: 4545–4594
Bullish Breakout Target: 4747–4792
Failure Below 4404: 4343 → 4242
Historically, June has produced substantial volatility around NFP. Given that Gold is currently sitting on a major long-term trendline support while DXY remains below 100, a weaker-than-expected NFP would have a higher probability of triggering a recovery toward 4545–4594, whereas a strong NFP combined with USDJPY above 160 could pressure Gold toward 4343–4242.
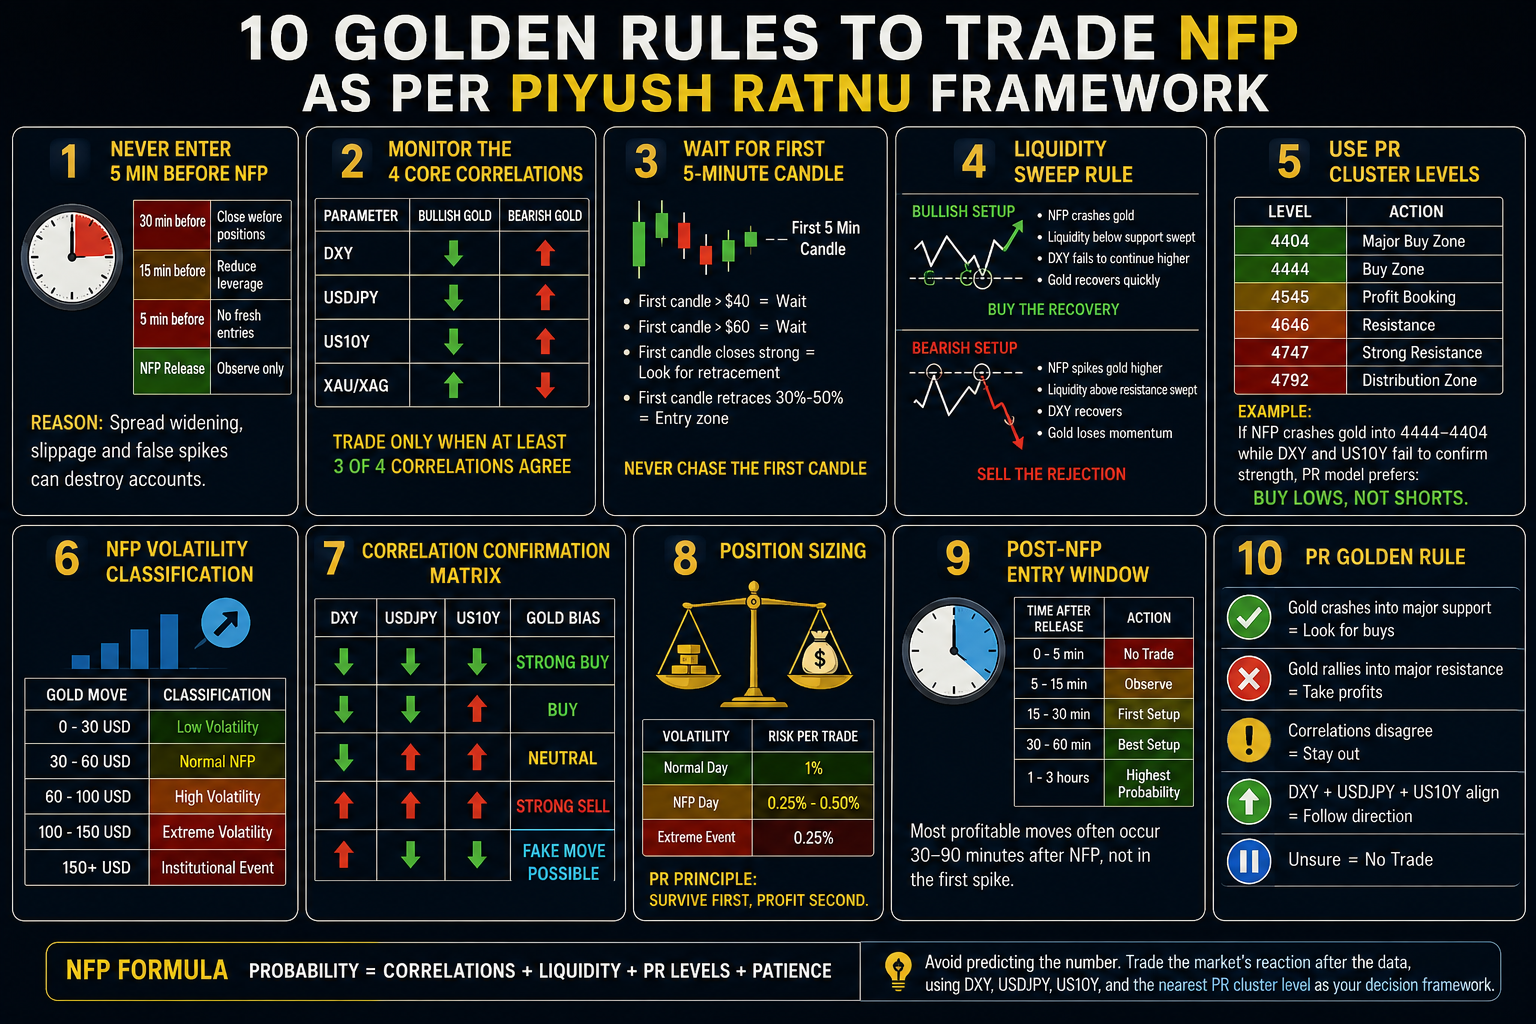
 Piyush Ratnu NFP Trading Rule Set (XAUUSD)
The objective is not to predict NFP, but to trade the reaction using liquidity, correlations, volatility, and key PR levels.
Rule #1 – Never Enter 5 Minutes Before NFP
| Time | Action |
|---|---|
| 30 mins before | Close weak positions |
| 15 mins before | Reduce leverage |
| 5 mins before | No fresh entries |
| NFP Release | Observe only |
Reason: Spread widening, slippage, and false spikes can destroy accounts.
Rule #2 – Monitor the 4 Core Correlations
| Parameter | Bullish Gold | Bearish Gold |
|---|---|---|
| DXY | Falling | Rising |
| USDJPY | Falling | Rising |
| US10Y | Falling | Rising |
| XAU/XAG | Rising | Falling |
PR Rule
Trade only when at least 3 of 4 correlations agree.
Rule #3 – Wait for First 5-Minute Candle
| Situation | Action |
|---|---|
| First candle > $40 | Wait |
| First candle > $60 | Wait |
| First candle closes strong | Look for retracement |
| First candle retraces 30%-50% | Entry zone |
Never chase the first candle.
Rule #4 – Liquidity Sweep Rule
Bullish Setup
- NFP causes gold crash.
- Liquidity below support gets swept.
- DXY fails to continue higher.
- Gold recovers quickly.
➡ Buy the recovery.
Bearish Setup
- NFP spikes gold higher.
- Liquidity above resistance gets swept.
- DXY recovers.
- Gold loses momentum.
➡ Sell the rejection.
Rule #5 – Use PR Cluster Levels
| Zone | Action |
|---|---|
| 4404 | Major Buy Zone |
| 4444 | Buy Zone |
| 4545 | Profit Booking |
| 4646 | Resistance |
| 4747 | Strong Resistance |
| 4792 | Distribution Zone |
Example
If NFP crashes gold into:
4444 → 4404
while DXY and US10Y fail to confirm strength,
PR model prefers:
Buy lows, not shorts.
Rule #6 – NFP Volatility Classification
| Gold Move | Classification |
|---|---|
| 0-30 USD | Low Volatility |
| 30-60 USD | Normal NFP |
| 60-100 USD | High Volatility |
| 100-150 USD | Extreme Volatility |
| 150+ USD | Institutional Event |
Rule #7 – Correlation Confirmation Matrix
| DXY | USDJPY | US10Y | Gold Bias |
|---|---|---|---|
| ↓ | ↓ | ↓ | Strong Buy |
| ↓ | ↓ | ↑ | Buy |
| ↓ | ↑ | ↑ | Neutral |
| ↑ | ↑ | ↑ | Strong Sell |
| ↑ | ↓ | ↓ | Fake Move Possible |
Rule #8 – Position Sizing
| Volatility | Risk Per Trade |
|---|---|
| Normal Day | 1% |
| NFP Day | 0.25%-0.50% |
| Extreme Event | 0.25% |
PR principle:
Survive first, profit second.
Rule #9 – Post-NFP Entry Window
| Time After Release | Action |
|---|---|
| 0-5 min | No Trade |
| 5-15 min | Observe |
| 15-30 min | First Setup |
| 30-60 min | Best Setup |
| 1-3 hours | Highest Probability |
Most profitable moves often occur 30–90 minutes after NFP, not in the first spike.
Rule #10 – PR Golden Rule
| Condition | Action |
|---|---|
| Gold crashes into major support | Look for buys |
| Gold rallies into major resistance | Take profits |
| Correlations disagree | Stay out |
| DXY + USDJPY + US10Y align | Follow direction |
| Unsure | No Trade |
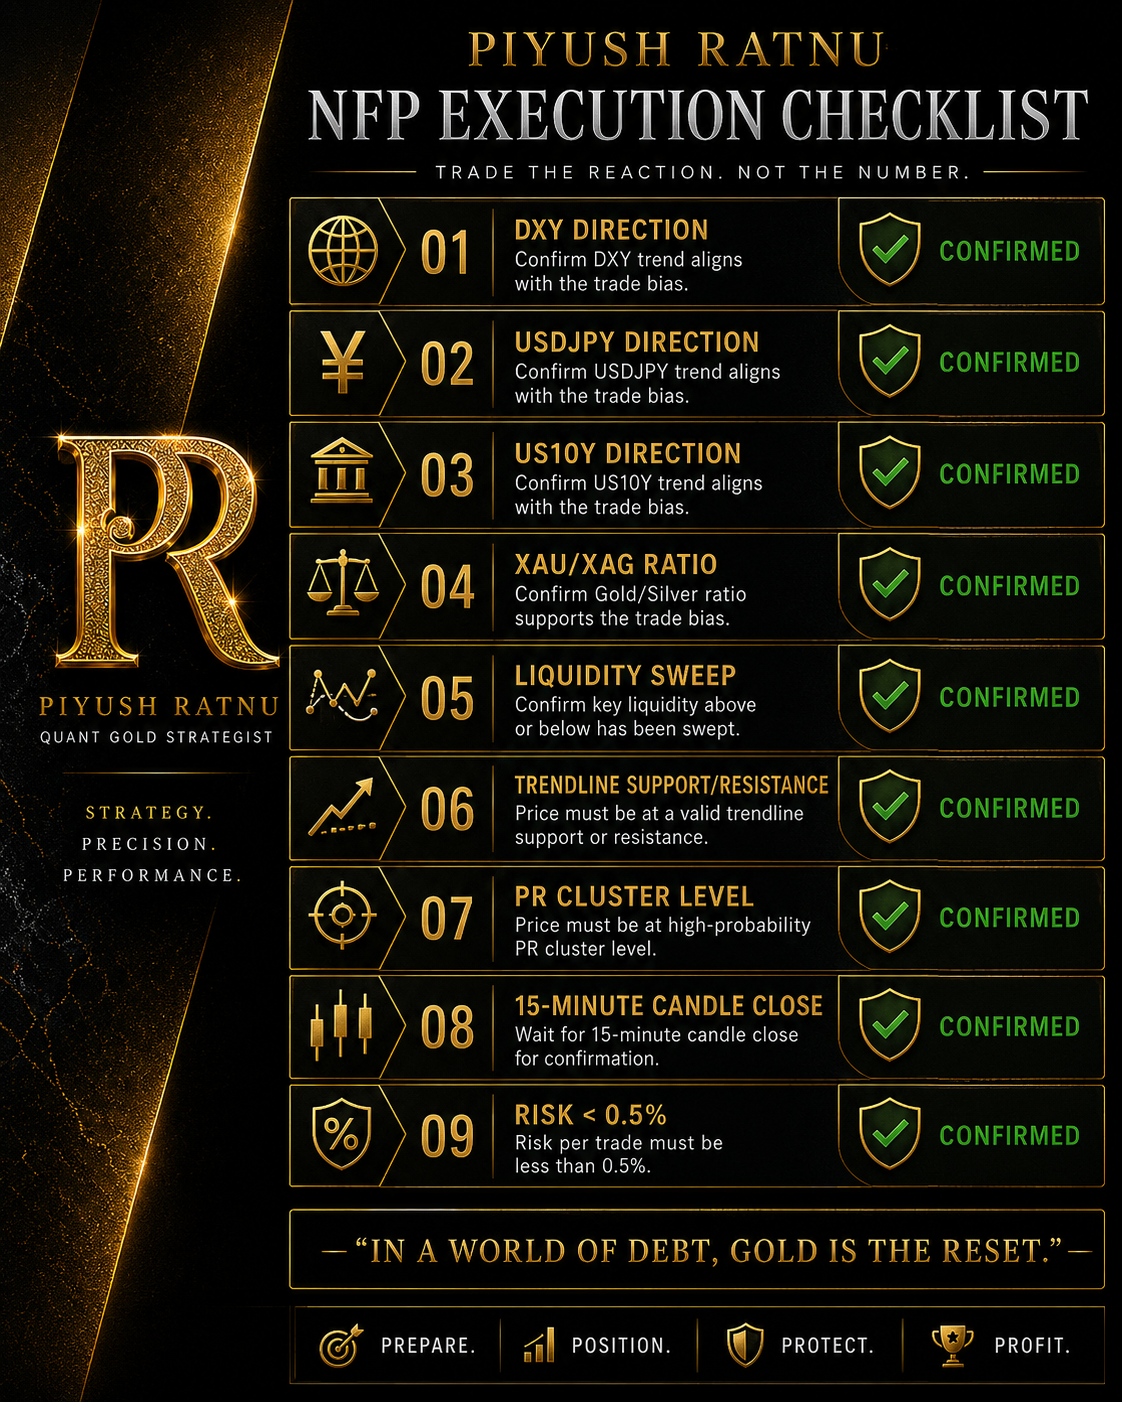
Piyush Ratnu NFP Execution Checklist
| Check | Status Required |
|---|---|
| DXY Direction | Confirmed |
| USDJPY Direction | Confirmed |
| US10Y Direction | Confirmed |
| XAU/XAG Ratio | Confirmed |
| Liquidity Sweep | Confirmed |
| Trendline Support/Resistance | Confirmed |
| PR Cluster Level | Confirmed |
| 15-Minute Candle Close | Confirmed |
| Risk < 0.5% | Confirmed |
 NFP Formula
Probability = Correlations + Liquidity + PR Levels + Patience
Avoid predicting the number. Trade the market’s reaction after the data, using DXY, USDJPY, US10Y, and the nearest PR cluster level as your decision framework.