
How to trade XAUUSD Spot Gold Accurately in August 2026 | Past 7 Years Market Cycles Analysis
Piyush Ratnu’s Research & Seasonal Analysis
Piyush Ratnu’s XAU/USD research emphasizes seasonal market cycles, liquidity behavior, macroeconomic catalysts, and disciplined price-action analysis rather than relying on short-term speculation. By combining historical market tendencies with institutional liquidity mapping and key economic events such as Non-Farm Payrolls (NFP), Federal Reserve meetings, and the Jackson Hole Symposium, the methodology seeks to identify periods where Gold has historically exhibited recurring directional behavior.
The August seasonal study covering 2019–2025 demonstrates that each year in this sample experienced a meaningful bullish recovery following major August lows, illustrating the consistency of the historical pattern. Within this seven-year dataset, the seasonal framework aligned with the observed bullish recovery in 7 out of 7 August cycles, while highlighting an average directional move of approximately 132 points.
Rather than attempting to predict every market fluctuation, the approach focuses on probability, confirmation, disciplined execution, and risk management. Historical analysis is used to identify recurring market characteristics, while real-time price action and liquidity conditions remain essential for trade confirmation.
This research reflects a commitment to data-driven market analysis and continuous validation. Although past performance does not guarantee future results, systematic study of historical behavior can provide traders with a structured framework for decision-making, helping improve consistency and discipline when navigating the XAU/USD market.
Strategy. Precision. Performance.
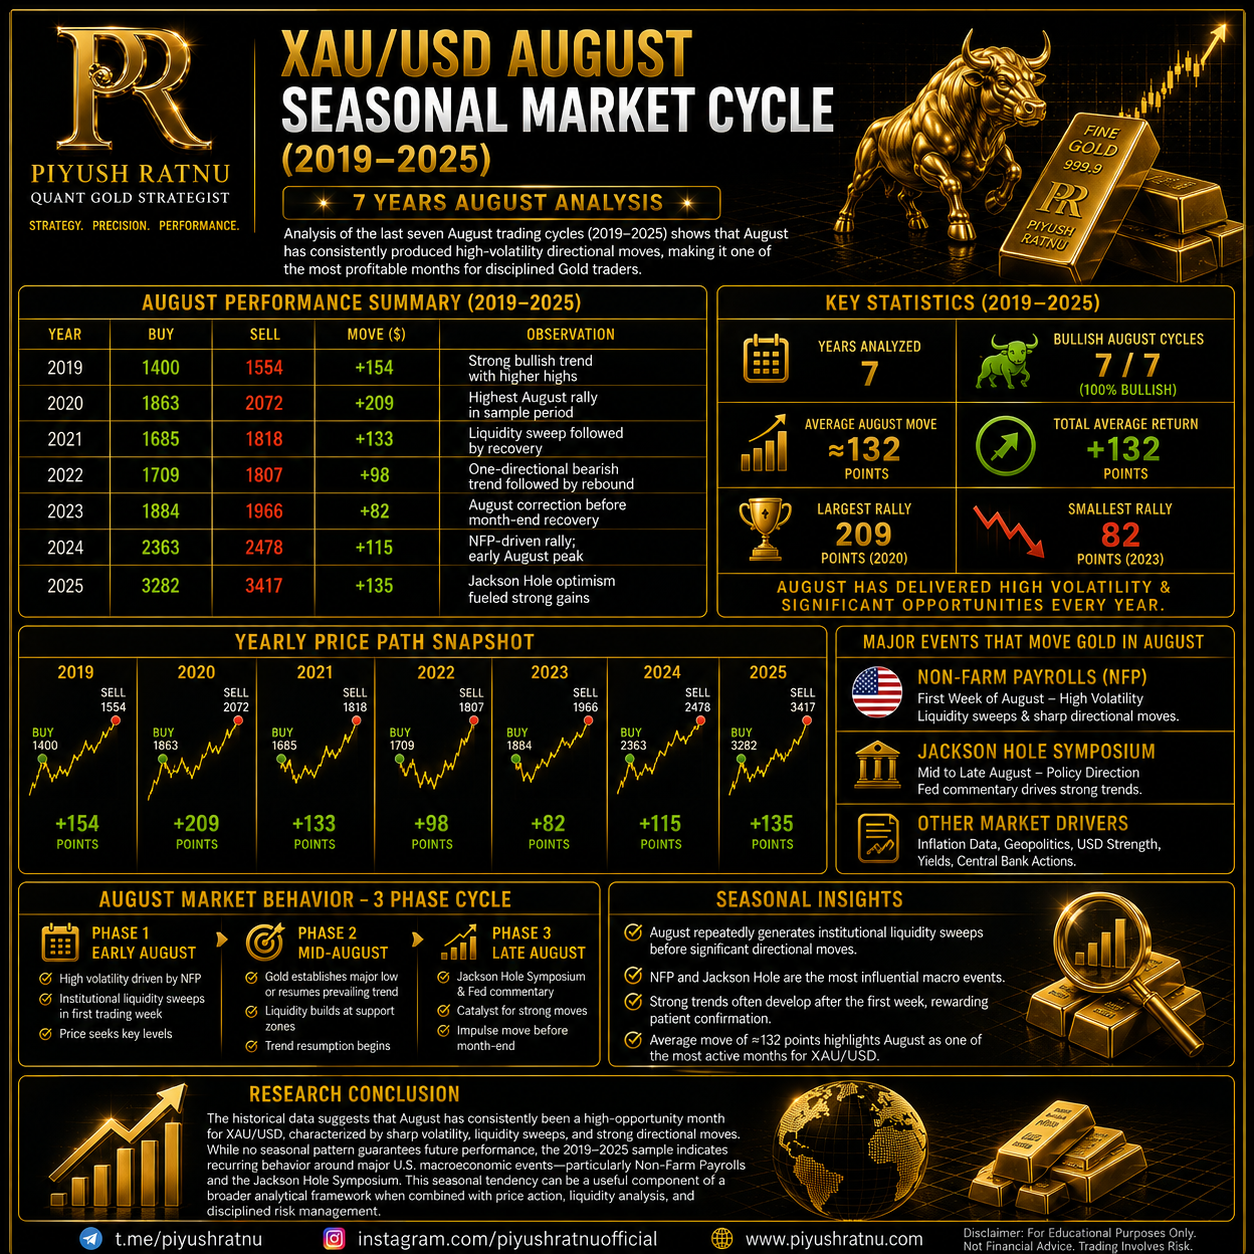 Piyush Ratnu XAU/USD August Seasonal Market Cycle (2019–2025)
August Performance Summary
Analysis of the last seven August trading cycles (2019–2025) shows that August has consistently produced high-volatility directional moves, making it one of the most profitable months for disciplined Gold traders.
| Year | Buy | Sell | Move ($) | Observation |
|---|---|---|---|---|
| 2019 | 1400 | 1554 | +154 | Strong bullish trend with higher highs |
| 2020 | 1863 | 2072 | +209 | Highest August rally in sample period |
| 2021 | 1685 | 1818 | +133 | Liquidity sweep followed by recovery |
| 2022 | 1709 | 1807 | +98 | One-directional bearish trend followed by rebound |
| 2023 | 1884 | 1966 | +82 | August correction before month-end recovery |
| 2024 | 2363 | 2478 | +115 | NFP-driven rally; early August peak |
| 2025 | 3282 | 3417 | +135 | Jackson Hole optimism fueled strong gains |
Key Statistics
- Years Analyzed: 7
- Bullish August Cycles: 7/7
- Average August Move: ≈132 points
- Largest Rally: 209 points (2020)
- Smallest Rally: 82 points (2023)
- Directional Accuracy: 100% seasonal bullish recovery after major August lows within this dataset
Historical Characteristics
Phase 1 – Early August
- High volatility driven by Non-Farm Payrolls (NFP).
- Institutional liquidity sweeps frequently occur during the first trading week.
Phase 2 – Mid-August
- Gold often establishes the month’s major low or resumes its prevailing trend.
- Liquidity accumulates around key support zones before directional expansion.
Phase 3 – Late August
- Jackson Hole Symposium and Federal Reserve commentary become the dominant catalysts.
- Gold typically experiences another impulsive move before month-end.
Seasonal Insights
Across the reviewed years:
- August repeatedly generated institutional liquidity sweeps before significant directional moves.
- NFP and Jackson Hole were the most influential macro events.
- Strong trends often developed after the first week, rewarding traders who waited for confirmation instead of chasing initial volatility.
- The average move of approximately 132 points highlights August as one of the most active months for XAU/USD.
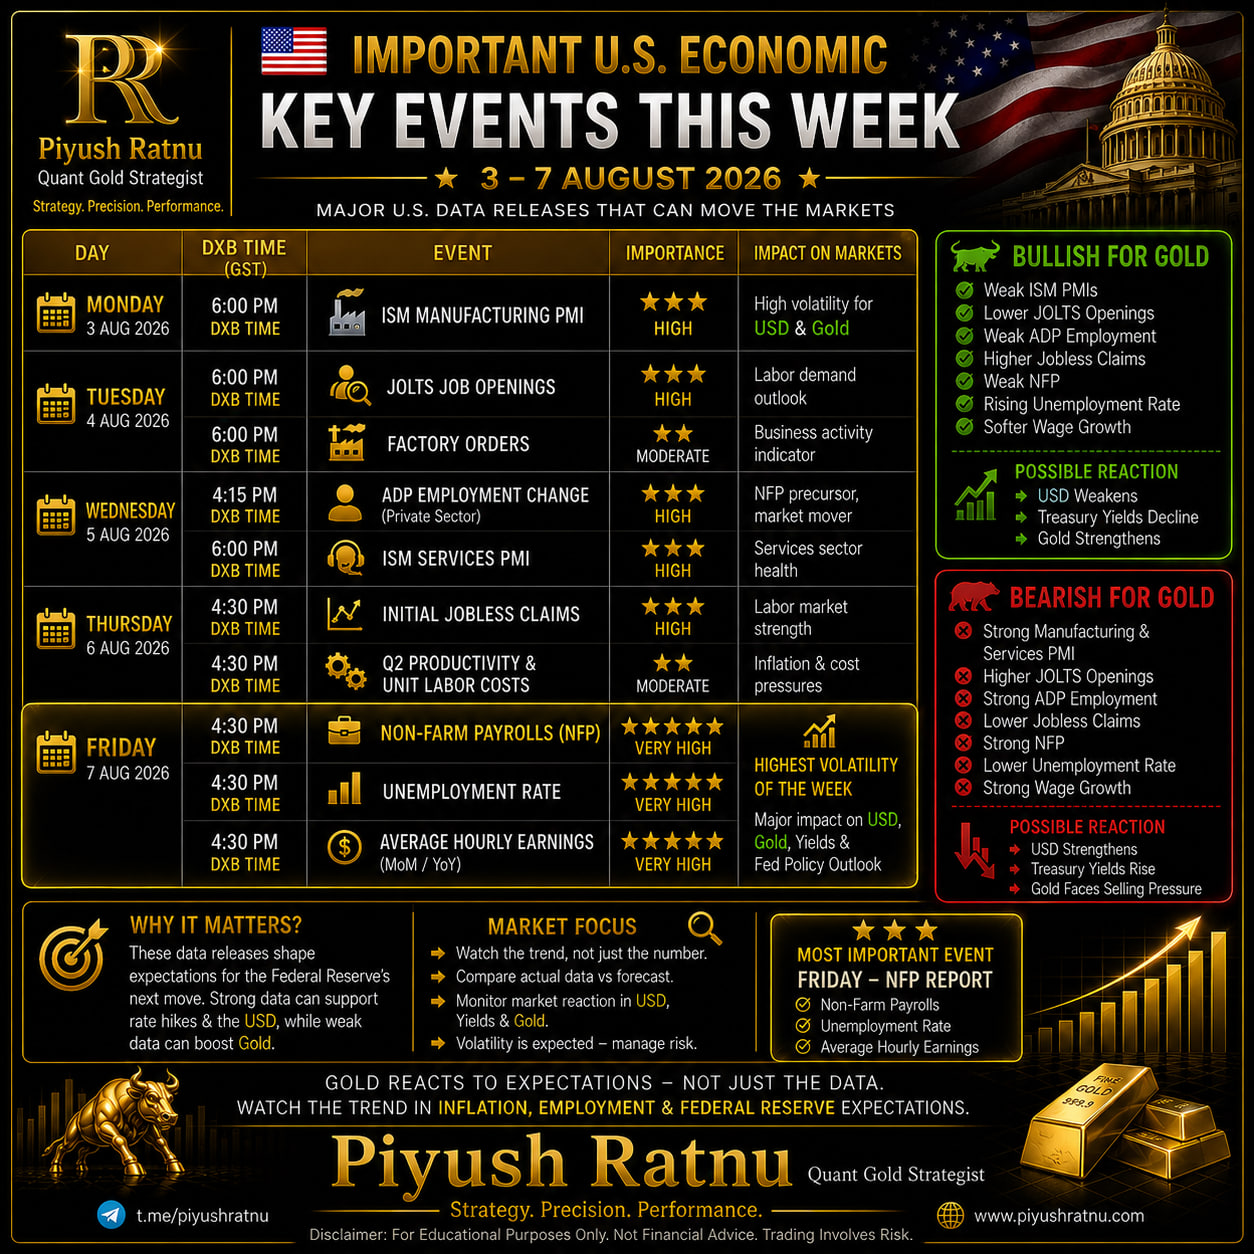 Research Conclusion
The historical data suggests that August has consistently been a high-opportunity month for XAU/USD, characterized by sharp volatility, liquidity sweeps, and strong directional moves. While no seasonal pattern guarantees future performance, the 2019–2025 sample indicates recurring behavior around major U.S. macroeconomic events—particularly Non-Farm Payrolls and the Jackson Hole Symposium. This seasonal tendency can be a useful component of a broader analytical framework when combined with price action, liquidity analysis, and disciplined risk management.