XAU/USD at $4,600: Why I Would Be Cautious Buying — and Equally Cautious Selling
Market Analysis by Piyush Ratnu — Quant Gold Strategist
Gold has now returned to an extremely important decision area around $4,590–$4,600. At first glance, the move looks strongly bullish. XAU/USD has recovered sharply from the $4,000 region, reclaimed important moving averages and is testing a major Fibonacci and historical price zone.
However, this is precisely where I would become more selective—not more aggressive.
My approach around $4,600 is simple:
I would be cautious buying Gold at $4,600, but I would be equally cautious selling Gold at $4,600.
Why?
Because the charts are showing a convergence of resistance, breakout potential, moving-average recovery and unusually important macro correlations.
This is a decision zone, not necessarily an automatic BUY or SELL zone.
Why $4,600 Is Technically Important
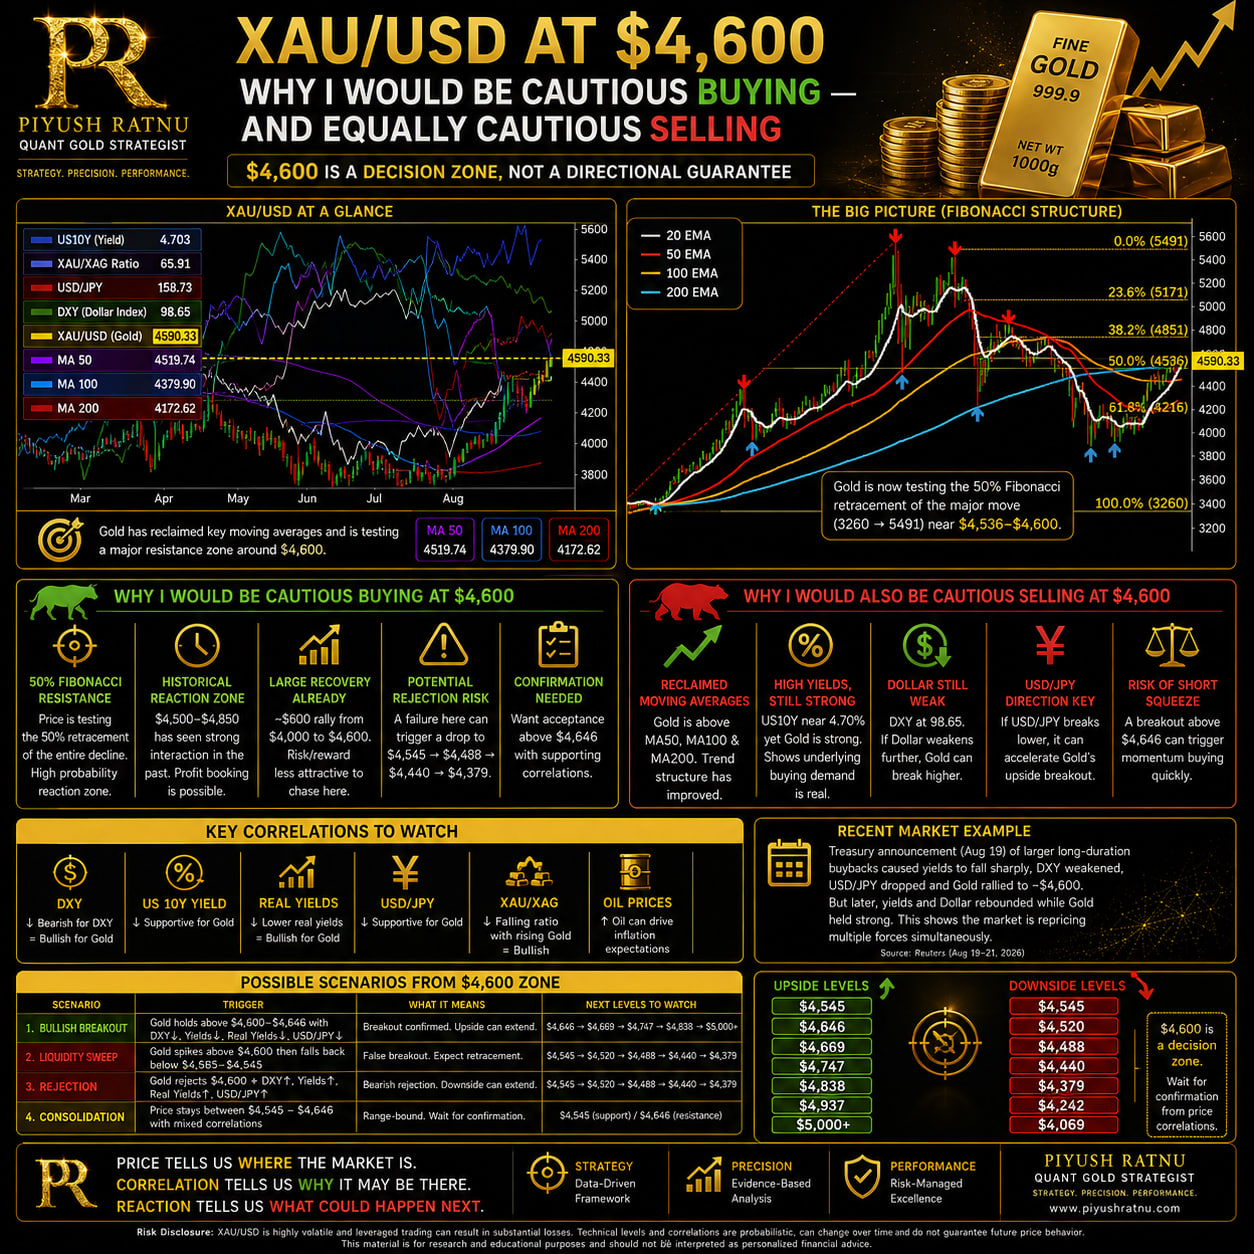
The second chart explains the technical problem very clearly.
Gold’s larger move extended from approximately $3,260 to $5,491 before entering a substantial corrective phase.
The subsequent decline took XAU/USD back toward the $3,900–$4,000 area before buyers returned.
Now Gold has recovered toward approximately $4,590, placing price almost directly into the important 50% Fibonacci retracement region of the larger decline.
That immediately makes $4,600 significant.
Price is no longer deeply discounted near the lows. But neither has it conclusively broken the larger resistance structure.
Gold is effectively sitting between two arguments.
The bears can say:
“Gold has rallied into major Fibonacci resistance after a very large recovery.”
The bulls can say:
“Gold has recovered from major support, reclaimed important moving averages and is attempting to break the corrective structure.”
Both arguments currently have merit.
That is exactly why aggressive positioning at $4,600 can be dangerous.
Why I Would Be Cautious BUYING at $4,600
The first mistake traders can make is assuming that because Gold has risen rapidly, buying at $4,600 must be safe.
Momentum alone is not enough.
1. Gold Is Testing the 50% Fibonacci Area
The larger Fibonacci structure places the 50% retracement around the current market region.
That makes approximately $4,535–$4,600 a natural decision area.
A Fibonacci level is not a magical reversal price. But when Fibonacci resistance overlaps with previous structure, moving averages and psychologically important round numbers, its relevance increases considerably.
Therefore, buying directly into $4,600 means buying into resistance rather than buying from support.
I would rather see the market prove acceptance above this region.
2. $4,600 Is Also a Historical Reaction Zone
Look at the larger chart.
The $4,500–$4,850 region has previously produced substantial interaction.
Gold has traded through this area during both advances and declines.
This means there can be considerable historical order flow here.
Previous buyers may use the recovery to reduce exposure.
Previous sellers may attempt to re-establish positions.
Short-term traders may take profits after the rapid advance from approximately $4,000.
Consequently, even if the ultimate direction remains bullish, a temporary rejection from $4,600 would not be surprising.
3. Gold Has Already Made a Significant Recovery
Gold has recovered roughly $600 from the $4,000 region to $4,600.
That matters.
Buying after a large vertical move creates a very different risk/reward profile from buying close to established support.
A trader entering around $4,600 may be correct about the long-term trend but still experience a correction toward:
$4,545 → $4,520 → $4,488 → $4,440 → $4,379
before the next advance begins.
Therefore:
Bullish does not automatically mean BUY at any price.
Price location matters.
But Why Would I Also Be Cautious SELLING $4,600?
This is the more important side of the analysis.
A resistance zone is not automatically a short signal.
Gold is arriving at $4,600 with improving momentum and, importantly, several macro relationships that are not giving me enough confidence to aggressively sell the rally.
1. Gold Has Reclaimed Major Moving Averages
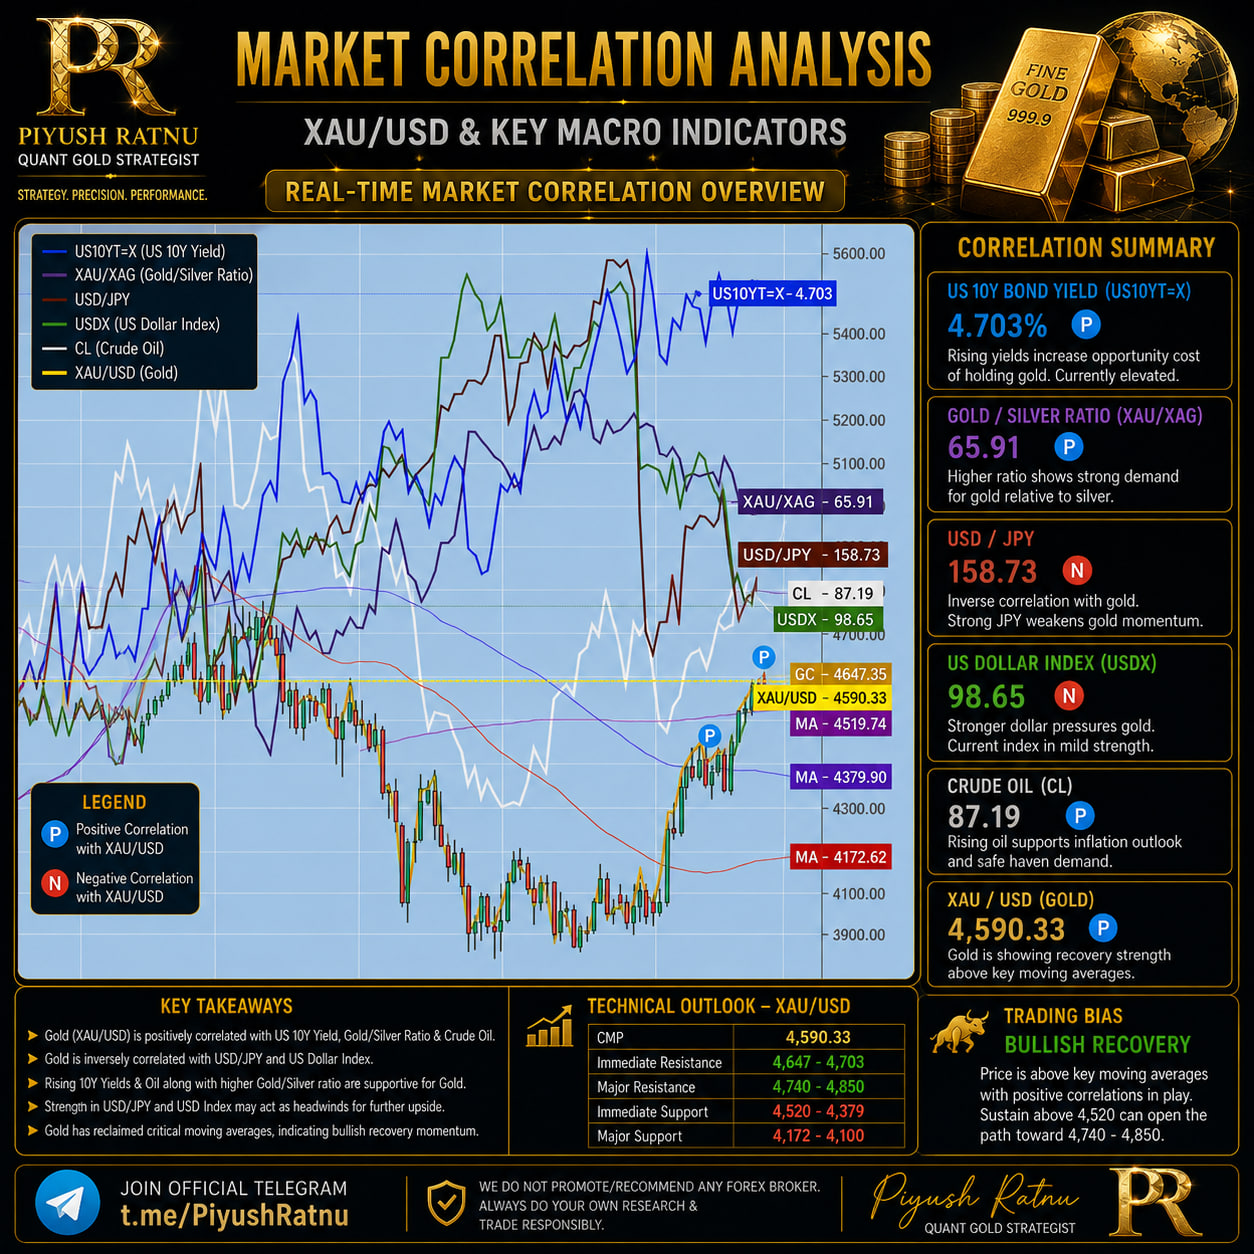
The first chart shows XAU/USD around $4,590, above moving-average references around approximately:
- $4,520
- $4,380
- $4,173
This changes the technical character of the market.
Gold is no longer trading below all of its major trend references.
Instead, price has climbed back above them.
That means traders selling $4,600 are effectively attempting to call a top while momentum is improving.
That can work—but it requires confirmation.
On August 21, Reuters reported that spot Gold reached approximately $4,601, its highest since May 15, after breaking its 200-day moving average. The move was supported by a weaker Dollar and technical momentum.
That is precisely why I would not mechanically short $4,600 simply because it looks expensive.
2. US10Y Is High — Yet Gold Is Also Rising
This is perhaps the most interesting observation in the first chart.
The US 10-year Treasury yield is around:
4.703%
Normally, higher Treasury yields can pressure Gold because they increase the opportunity cost of holding a non-yielding asset.
Yet Gold is around $4,590 despite US10Y remaining elevated.
That divergence deserves attention.
The World Gold Council has noted that although real rates historically had an important inverse relationship with Gold, the relationship has become less straightforward since 2022 as central-bank demand, geopolitical risk and other factors have offset higher real rates.
Therefore, I would ask:
If Gold can hold around $4,600 while the US10Y remains near 4.70%, what happens if yields subsequently fall?
That could potentially provide Gold with another bullish catalyst.
This is one reason I would hesitate to aggressively sell.
3. DXY Near 98.65 Is Important
The chart shows DXY around 98.65.
A comparatively weak Dollar is generally supportive for dollar-denominated Gold.
Historically, Gold and the Dollar have often maintained a negative relationship, although the correlation is not constant. The World Gold Council has specifically highlighted Dollar weakness as an important positive force for Gold during 2026.
Therefore, a bearish Gold trade around $4,600 becomes more convincing to me if DXY begins recovering strongly.
For example:
DXY 98.65 → 99.00 → 99.50 → 100+
combined with rising yields could create a much stronger bearish confirmation.
But if DXY instead breaks lower:
98.65 → 98.00 → 97.50
while Gold holds above $4,545–$4,600, selling Gold becomes considerably more dangerous.
4. USD/JPY Around 158.73 Requires Close Attention
USD/JPY is another major component of my correlation framework.
The chart shows approximately:
USD/JPY 158.73
I have repeatedly monitored USD/JPY alongside Gold because the pair can reflect US/Japan yield differentials, Dollar behavior, carry positioning and changes in global liquidity.
The crucial issue now is direction.
If USD/JPY begins breaking downward while DXY weakens and Treasury yields decline, I would view that combination as potentially supportive for Gold.
Recent market action provides an example of why this matters. Following the Treasury’s announcement concerning larger long-duration bond buybacks, long-term yields initially declined, the Dollar weakened, the yen strengthened and Gold rallied.
That is exactly the type of multi-market confirmation I want to see.
I do not want to evaluate XAU/USD in isolation.
5. XAU/XAG Around 65.91 Adds Another Layer
The Gold/Silver ratio is shown near:
65.91
This ratio helps us understand relative strength within precious metals.
A falling XAU/XAG ratio while both metals rise can indicate that Silver is participating aggressively in the precious-metals move.
That can sometimes signal broader risk appetite within the metals complex rather than an isolated Gold spike.
Therefore, I would monitor whether Gold’s breakout is being confirmed by Silver.
A healthy precious-metals advance generally becomes more interesting when participation broadens.
The Recent Move Provides an Important Lesson
The market has already demonstrated why blindly trading a single correlation can fail.
On August 19, the Treasury announcement regarding increased long-duration buybacks pushed long-term yields sharply lower and weakened the Dollar, while Gold surged. Reuters reported that the 30-year Treasury yield fell almost 10 basis points following the announcement.
But the reaction did not remain perfectly linear.
The Dollar subsequently recovered somewhat and Treasury yields rebounded as markets questioned how powerful the buyback program would ultimately be.
Yet Gold remained strong enough to challenge $4,600.
That tells me something important:
The market is currently repricing several competing forces simultaneously.
This is why I prefer confirmation over prediction at $4,600.
Scenario 1 — Bullish Breakout Above $4,600
My first scenario is a genuine breakout.
I would become increasingly constructive if Gold establishes acceptance above approximately:
$4,600–$4,646
especially if accompanied by:
DXY ↓
US10Y ↓
US30Y ↓
Real yields ↓
USD/JPY ↓
Gold/Silver participation ↑
XAU/USD closes above resistance
Under that scenario, $4,600 would stop behaving as resistance and could begin becoming support.
The next areas I would monitor include:
$4,646
$4,669
$4,747
$4,838
$4,937
$5,000+
The important element is not simply touching $4,600.
It is acceptance above $4,600.
Scenario 2 — Liquidity Sweep Above $4,600
This is the scenario that makes chasing Gold particularly dangerous.
Gold could trade:
$4,590 → $4,610 → $4,646
and attract breakout buyers.
Then price could rapidly fall back below $4,600.
That would represent a potential liquidity sweep or failed breakout.
If Gold subsequently loses:
$4,585 → $4,545 → $4,520
I would become increasingly cautious about the immediate bullish continuation.
A deeper retracement could then expose:
$4,488
$4,440
$4,379
This is why I would not buy merely because the screen prints $4,601.
I want to know whether the market can hold the breakout.
Scenario 3 — Rejection From $4,600
A clear rejection becomes more meaningful if correlations reverse simultaneously.
For example:
**Gold fails $4,600
- DXY rises
- US10Y rises
- real yields rise
- USD/JPY strengthens
- Gold falls back below $4,545**
That is a materially stronger bearish signal than $4,600 resistance alone.
Under such circumstances, I would monitor:
$4,545
$4,520
$4,488
$4,440
$4,379
A sustained deterioration below the moving-average structure would then make deeper downside scenarios increasingly relevant.
Scenario 4 — The Most Dangerous Market: Consolidation Around $4,600
There is another possibility traders frequently underestimate.
Gold may simply consolidate around:
$4,545–$4,646
without immediately selecting direction.
This could create repeated false breakouts above $4,600 and false breakdowns below $4,545.
That is the environment in which both aggressive buyers and aggressive sellers can lose money.
For me, this is another reason not to force a trade merely because price has reached an important level.
Sometimes the correct position is observation.
Past Price Behavior Explains My Caution
My previous XAU/USD work has repeatedly focused on predefined cluster levels rather than chasing price after large moves.
Zones such as $4,343, $4,242, $4,069, $3,969, $4,444, $4,488, $4,545, $4,646 and $4,669 have been used as reference points for determining whether price is approaching support, resistance, liquidity or a potential transition area.
The lesson from those previous market moves is simple:
Price frequently reacts around important zones before revealing its true direction.
For example, a target being reached does not automatically mean reversal.
Likewise, resistance being reached does not automatically mean SELL.
The reaction after the level is touched is more important than the level itself.
That principle becomes especially relevant around $4,600.
The $4,600 Decision Matrix
I would be cautious BUYING when:
Gold reaches $4,600 after an extended rally, fails to hold above it, DXY begins recovering, Treasury and real yields rise, USD/JPY strengthens, and XAU/USD falls back below $4,545–$4,520.
I would be cautious SELLING when:
Gold holds above $4,600, DXY continues weakening, Treasury/real yields decline, USD/JPY breaks lower and XAU/USD establishes acceptance above $4,646.
I would remain patient when:
The correlations disagree.
That third scenario is extremely important.
If Gold is rising but DXY, yields and USD/JPY are simultaneously rising, I want to understand why Gold is refusing to fall before taking a large short position.
Likewise, if Gold is failing to advance despite falling yields and a weaker Dollar, I want to know why buyers are unable to capitalize on favorable conditions before chasing the market higher.
Relative reaction contains information.
My Approach at $4,600
At this stage, I do not view $4,600 as a simple BUY or SELL button.
I view it as a confirmation zone.
Gold has recovered substantially.
The larger technical chart places price around an important Fibonacci region.
The market has reclaimed important moving averages.
The Dollar is relatively weak.
Treasury yields remain elevated, yet Gold has demonstrated impressive resilience.
And recent Treasury-market developments have introduced another potentially important catalyst.
Current reporting confirms just how unusual the combination is: Gold has reached approximately $4,600 while the US 10-year yield remains around 4.7%, with the Dollar under pressure amid fiscal and Treasury-market concerns.
That makes the next reaction more important than the headline price itself.
 My conclusion:
Do not BUY $4,600 simply because Gold is bullish.
Do not SELL $4,600 simply because Gold looks expensive.
Watch whether the market accepts or rejects the zone.
Watch US10Y.
Watch US30Y.
Watch real yields.
Watch DXY.
Watch USD/JPY.
Watch XAU/XAG.
And above everything else:
Watch how XAU/USD reacts when those correlations move.
If Gold remains strong despite traditionally bearish correlations, that relative strength should not be ignored.
If Gold fails to rise despite traditionally bullish correlations, that weakness should not be ignored either.
That is how I approach the $4,600 zone.
Price tells us where the market is.
Correlation tells us why it may be there.
Reaction tells us what could happen next.
— Piyush Ratnu
Quant Gold Strategist
Strategy. Precision. Performance.
Risk Disclosure: This analysis presents market scenarios for educational and research purposes. XAU/USD is highly volatile, and leveraged trading involves substantial risk. Technical levels and correlations are probabilistic, can change over time and do not guarantee future price behavior.