JACKSON HOLE + PCE + U.S. TREASURY POLICY
The Next Major XAU/USD Volatility Trigger
By Piyush Ratnu | Quant Gold Strategist | Quantamental Financial Research
From my perspective, the market is approaching a particularly important convergence of monetary policy, inflation, Treasury-market intervention and fiscal risk. Rather than analysing Jackson Hole, PCE or Treasury buybacks independently, I am looking at how all three catalysts interact with Treasury yields, real yields, DXY, USD/JPY and ultimately XAU/USD.
 The immediate question is not simply whether Gold is bullish or bearish. The more important question is:
Which macro catalyst will force the next major repricing—and will the correlations confirm it?
1. The Jackson Hole Factor
Investors are awaiting Fed Chair Kevin Warsh’s keynote address at the Kansas City Fed’s annual Jackson Hole Economic Policy Symposium. The symposium runs August 27–29, 2026 and has historically provided an important platform for communicating changes in monetary-policy thinking.
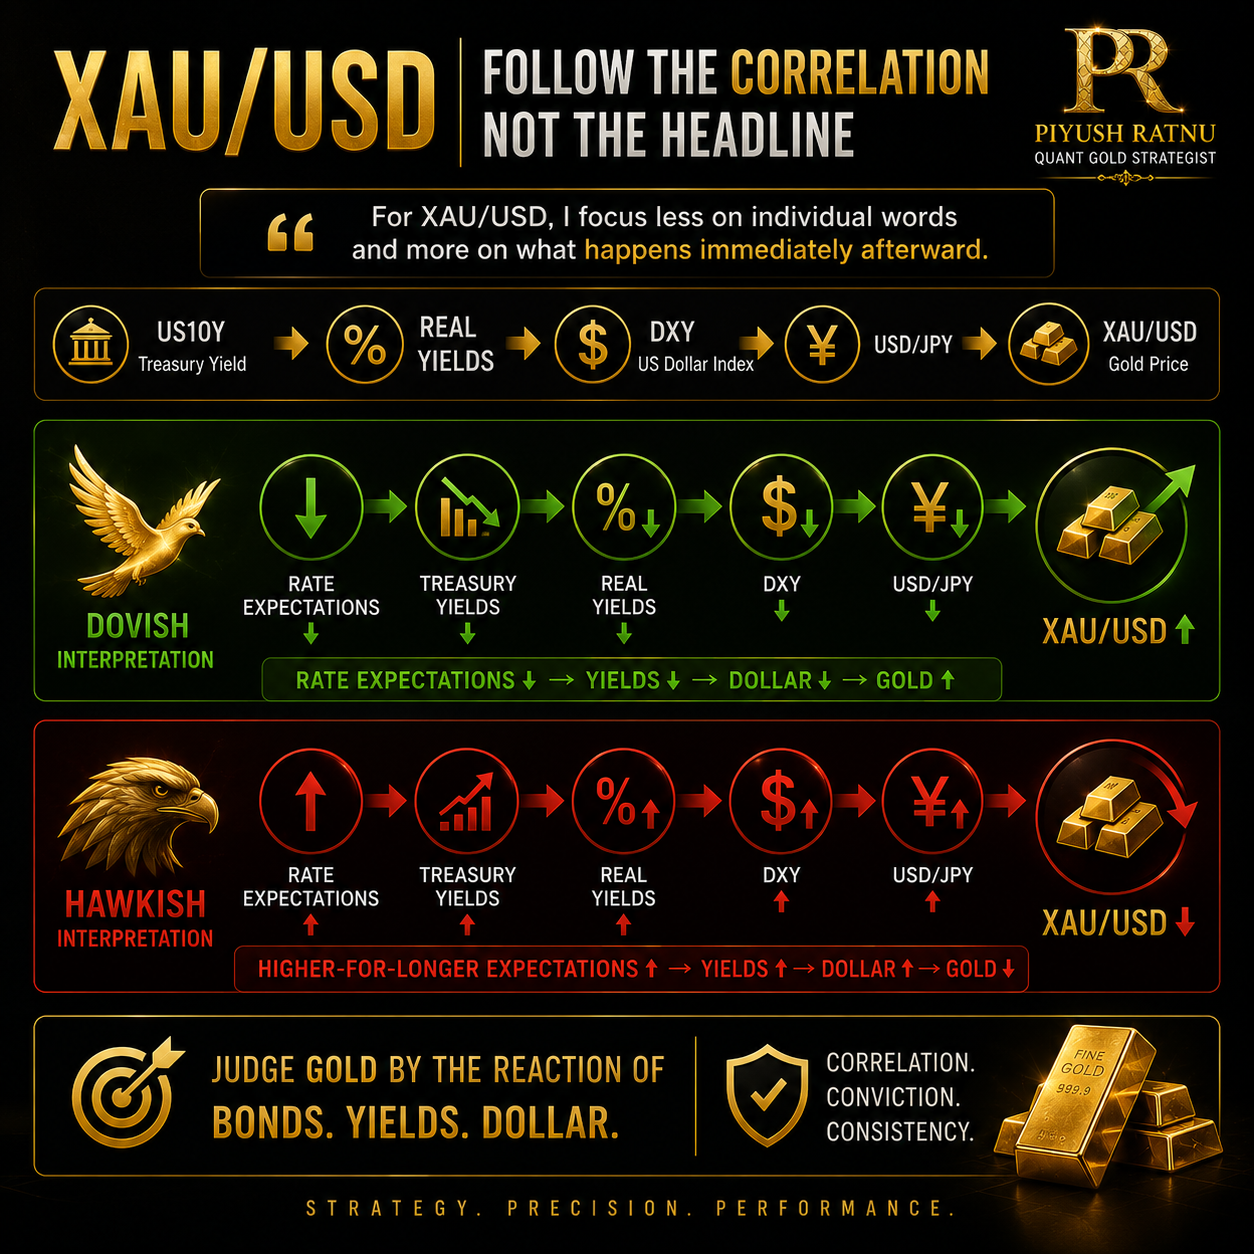
For XAU/USD, I will focus less on individual words such as hawkish or dovish and more on what happens immediately afterward in:
US10Y → Real Yields → DXY → USD/JPY → XAU/USD
A dovish interpretation would generally favor:
Rate expectations ↓ → Treasury yields ↓ → Real yields ↓ → DXY ↓ → XAU/USD ↑
A hawkish interpretation could produce:
Higher-for-longer expectations ↑ → Treasury yields ↑ → Real yields ↑ → DXY ↑ → XAU/USD ↓
Gold’s reaction should therefore be judged together with the bond and currency markets.
2. PCE: The Inflation Test
July PCE is the second major variable.
With headline PCE expected to moderate slightly to approximately 3.6% YoY, the crucial issue is whether the data provide Warsh with room to soften the Fed’s stance—or reinforce the argument that inflation remains too persistent for easier monetary policy.
Softer PCE
Inflation pressure ↓
→ Fed tightening expectations ↓
→ Real yields potentially ↓
→ Dollar potentially ↓
→ Positive for Gold
Hotter PCE
Inflation pressure ↑
→ Higher-for-longer expectations ↑
→ Treasury/real yields potentially ↑
→ Dollar potentially ↑
→ Negative for Gold
But Gold’s response may become more complicated if persistent inflation is accompanied by deteriorating confidence in U.S. fiscal policy. In such an environment, inflation itself can eventually strengthen demand for Gold as a monetary hedge.
3. The Bessent Factor — Potentially Bigger Than the Headline
I believe traders should pay particularly close attention to Treasury Secretary Scott Bessent.
The Treasury surprised the bond market by announcing that the maximum size of certain long-end liquidity-support buybacks will increase from $2 billion to at least $4 billion per operation, effective September 9. The change applies to the 10–20 year and 20–30 year nominal coupon sectors.
But the market’s next question is more important:
What comes after the buyback expansion?
Bond investors are seeking greater clarity around the “financial initiative” associated with addressing America’s large fiscal deficit.
For me, this creates a new analytical dimension for Gold.
If Treasury measures successfully reduce long-duration yields:
Treasury support ↑ → Bond prices ↑ → Long yields ↓ → Dollar pressure ↑ → Gold support ↑
But if investors interpret intervention as evidence of deeper concerns about deficits, debt servicing and Treasury-market stability, another mechanism could emerge:
Fiscal concern ↑ → Confidence in long-term U.S. debt ↓ → Monetary/fiscal risk premium ↑ → Alternative store-of-value demand ↑ → Gold ↑
This is why simply assuming “Treasury buys bonds = Gold rises” is inadequate.
The reaction of US10Y and US30Y will tell us much more.
My XAU/USD Quantamental Correlation Dashboard
The strongest bullish configuration I would want to see is:
US10Y ↓ + US30Y ↓ + REAL YIELDS ↓ + DXY ↓ + USD/JPY ↓ = XAU/USD ↑
Conversely:
US10Y ↑ + US30Y ↑ + REAL YIELDS ↑ + DXY ↑ + USD/JPY ↑ = XAU/USD ↓
I would also monitor crude oil and XAU/XAG.
Higher oil prices could keep inflation expectations elevated, while geopolitical tensions can simultaneously generate safe-haven demand for Gold. That creates the possibility of conflicting forces—exactly why correlation confirmation is essential.
 PIYUSH RATNU — XAU/USD EVENT RANGE MAP
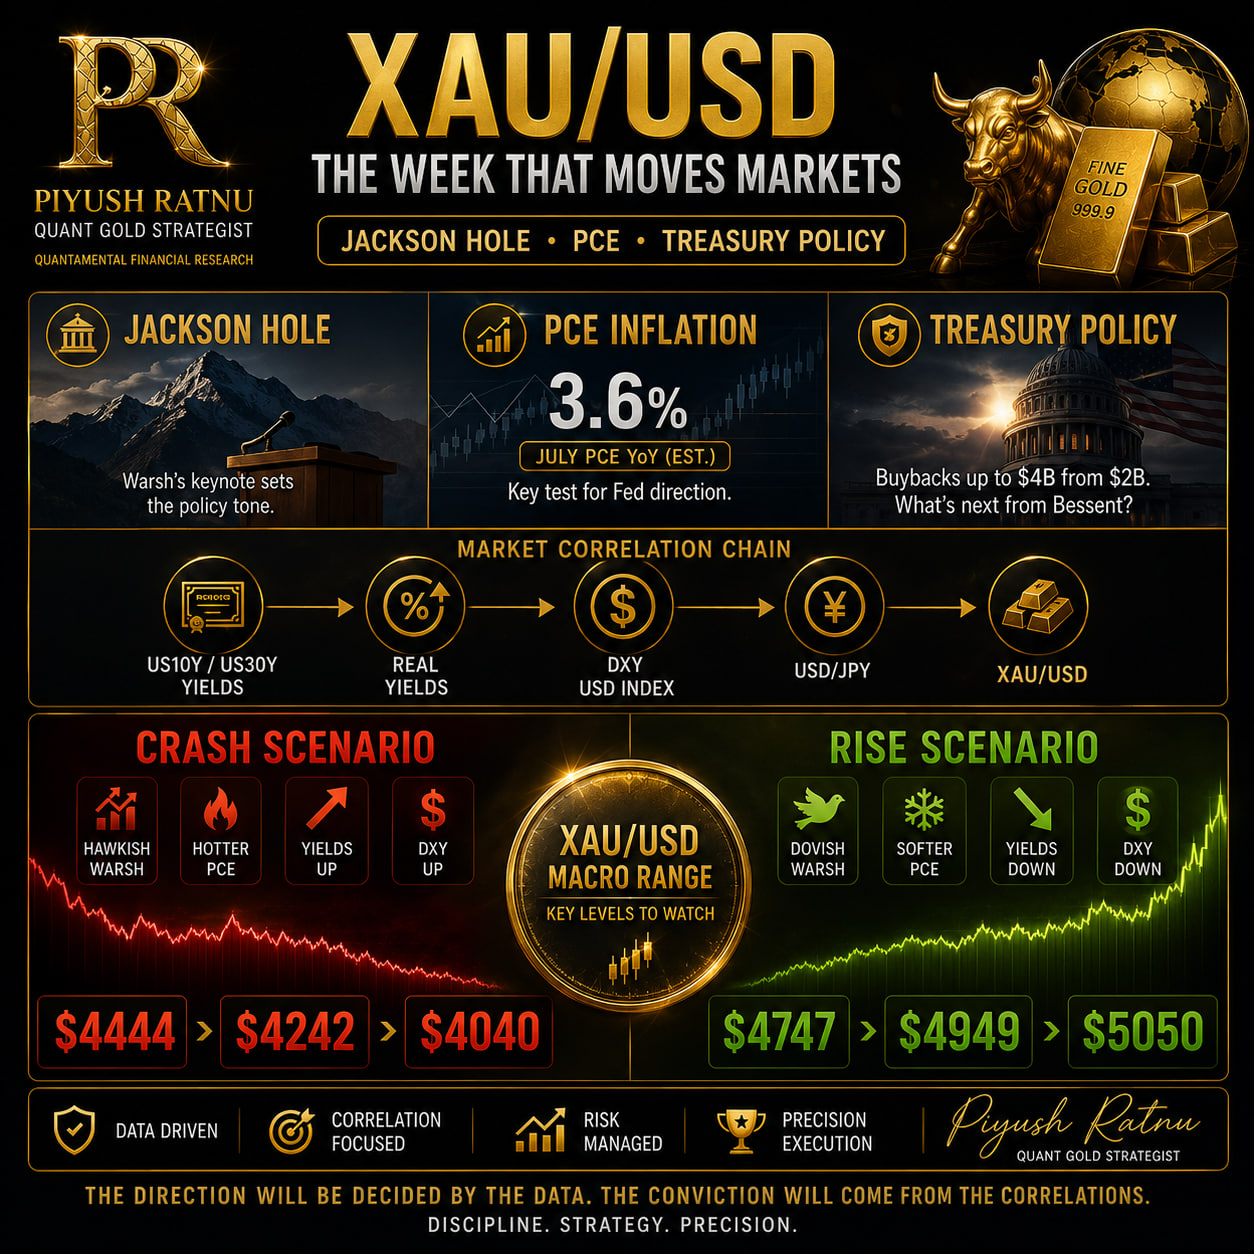
With Jackson Hole, PCE and Treasury policy converging, I am treating the following levels as scenario zones rather than guaranteed price targets.
🔴 CRASH / DOWNSIDE SCENARIO
$4,444 → $4,242 → $4,040
$4,444 — First major downside reference
↓
$4,242 — Major correction / liquidity zone
↓
$4,040 — Extreme bearish extension
A hawkish Jackson Hole outcome combined with hot PCE + rising US10Y + rising real yields + stronger DXY would materially increase downside risk.
🟢 RISE / UPSIDE SCENARIO
$4,747 → $4,949 → $5,050
$4,747 — First major upside objective
↑
$4,949 — Major bullish extension
↑
$5,050 — Higher breakout scenario
A dovish Warsh interpretation combined with soft PCE + falling Treasury yields + falling real yields + weaker DXY/USDJPY would strengthen this scenario.
THE TWO PATHS
HAWKISH WARSH
- PCE hotter than expected
- US10Y ↑
- Real yields ↑
- DXY ↑
- USD/JPY ↑
→ XAU/USD: $4,444 → $4,242 → $4,040
versus
DOVISH WARSH
- PCE softer than expected
- US10Y ↓
- Real yields ↓
- DXY ↓
- USD/JPY ↓
→ XAU/USD: $4,747 → $4,949 → $5,050
There is also a third possibility: extreme two-way volatility. Gold could initially move sharply in one direction on Warsh’s remarks, reverse as Treasury yields reprice, and then move again following PCE. For that reason, the first reaction should not automatically be treated as the final direction.
My Perspective
I see this as much more than another economic-data week.
Jackson Hole tests monetary-policy expectations. PCE tests inflation. Bessent tests Treasury-market confidence. US10Y and real yields test the bond market. DXY tests the Dollar—and XAU/USD ultimately reflects the combined verdict.
That is why I will be watching the correlations rather than attempting to predict the outcome from headlines alone.
XAU/USD MACRO RANGE
🔴 CRASH: $4,444 / $4,242 / $4,040
🟢 RISE: $4,747 / $4,949 / $5,050
The direction will be decided by the data. The conviction will come from the correlations.
— Piyush Ratnu
Quant Gold Strategist | XAU/USD Analyst & Trader
Quantamental Financial Research • Market Intelligence
These are scenario levels for market analysis, not guaranteed targets or investment advice.