The $4,269 XAU/USD Price Map: Projected Before FOMC, Traded Through the Volatility, Validated by Price
How Piyush Ratnu combines advance price mapping, macro correlations and disciplined execution around major economic events
1. The Methodology: Projection Before Reaction
My approach to XAU/USD has never been based on reacting to a candle after the move has already occurred. The foundation of my methodology is to identify important price zones before the market reaches them, then continuously evaluate those levels against macroeconomic developments, liquidity behaviour, technical structure and intermarket correlations.
The September FOMC provided a particularly useful case study of this approach. On 14 September 2026, before the Federal Reserve decision, I identified $4,269 as an important downside price map for XAU/USD. The purpose of establishing the level in advance was not to predict every candle between the prevailing market price and $4,269. It was to define a destination around which trading decisions could be structured if the macro environment developed as expected.
That distinction is central to my methodology: forecast the zone first, wait for confirmation, execute according to price location, and validate the projection only after the market has delivered the result.
Who Projected on 14 September 2026: The $4,269 XAUUSD Price Map: Projected Before FOMC, Traded Through the Volatility, Validated by Price
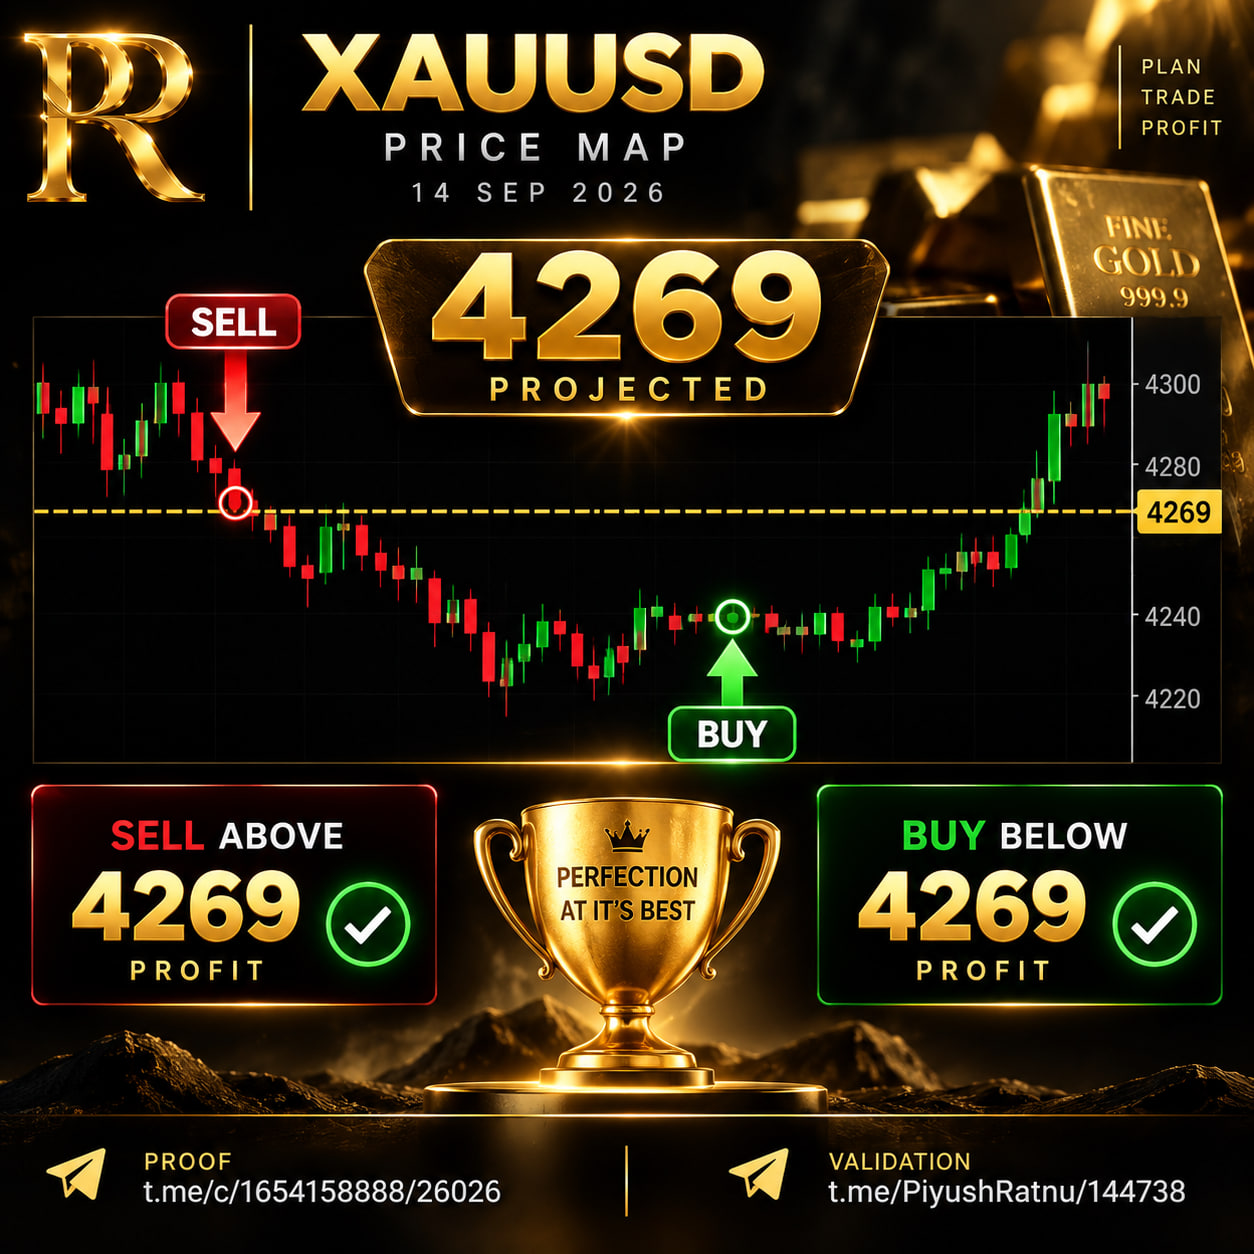 2. $4,269: A Price Level Defined Before the FOMC Volatility
The significance of $4,269 is therefore not simply that Gold eventually traded around and below it. The important point is the chronology.
The $4,269 downside level was published on 14 September, before the FOMC decision and before the subsequent volatility unfolded. This created a measurable reference point against which the analysis could later be assessed.
For me, accuracy should not be judged by highlighting a level retrospectively. A meaningful market projection needs a timestamp, a clearly defined price and subsequent market evidence showing whether that price was actually reached.
That is why I place considerable importance on maintaining a transparent record of projections. Prediction comes first; validation comes afterward.
3. FOMC Provided the Catalyst
The Federal Reserve then supplied the macroeconomic catalyst.
At its 16 September 2026 meeting, the FOMC unanimously increased the federal-funds target range by 25 basis points to 3.75%–4.00%. More importantly for Gold, the accompanying projections indicated a higher expected policy-rate path.
This distinction matters because Gold does not respond mechanically to the headline interest-rate decision alone.
The market must interpret the complete policy package: the decision itself, future rate expectations, inflation projections, Treasury yields, the US Dollar and changes in real-rate expectations.
The resulting repricing generated substantial volatility in XAU/USD.
4. The Rally Before the Reversal Was Equally Important
Before the FOMC outcome, Gold initially demonstrated considerable strength. Spot Gold advanced above $4,350, with easing Treasury yields contributing to the upward move.
This was precisely the type of environment where blindly anticipating an immediate FOMC crash could have been dangerous.
Instead of treating the market as a simple equation of rate hike equals sell Gold, my methodology requires confirmation from the broader correlation structure.
Once the Fed’s policy message was absorbed, conditions changed. Gold reversed sharply from its intraday highs and subsequently traded through the region I had mapped in advance. Contemporary market reporting recorded Gold falling more than 1% following the decision.
The sequence demonstrated why price mapping and confirmation can be more useful than attempting to predict the first reaction to an economic headline.
5. Correlations Explained the Change in Market Behaviour
My XAU/USD analysis does not operate in isolation.
I continuously study Gold alongside US Treasury yields, DXY, USD/JPY and other relevant cross-market relationships. These correlations do not remain perfectly synchronized every minute, but when several begin confirming the same macroeconomic narrative, they can provide important context for Gold’s directional movement.
Around the FOMC decision, the interaction between Treasury yields and the US Dollar became particularly important. Reuters reported the benchmark 10-year Treasury yield around 4.958% immediately following the announcement, compared with approximately 4.946% shortly before it, while the Dollar strengthened.
That created a more difficult macro environment for non-yielding Gold.
The relationship I was watching was straightforward:
US yields strengthening + DXY strengthening → increasing pressure on XAU/USD.
But correlations are confirmation tools, not guarantees. I therefore combine them with predefined price zones rather than using any single correlated market as an automatic trading signal.
6. Selling Above $4,269 Was Only the First Half of the Strategy
This is where the methodology becomes particularly important.
When Gold remained significantly above $4,269 and the macro structure supported downside repricing, the previously mapped level provided a destination for the bearish phase.
Therefore, the framework was effectively:
Price above $4,269 → downside destination remained active.
Selling from higher prices toward the projected region could therefore benefit from the movement toward the predefined objective.
But reaching a downside target changes the trading equation.
A common mistake is to correctly identify a falling market and then continue selling after price has already reached the original downside objective. My approach is different.
Once the projected destination is achieved, I reassess the market rather than mechanically extending the previous bias.
7. The Same $4,269 Level Then Became a Reference for Buying
After Gold reached and traded below the projected $4,269 region, the methodology shifted.
The level was no longer simply a destination for selling from above. Price had entered the area where I was prepared to examine buying opportunities below $4,269, provided the price action and correlation structure supported recovery.
 This created a very different trading proposition:
Selling above $4,269 participated in the decline. Buying below $4,269 participated in the subsequent recovery opportunities.
This does not mean $4,269 magically determines market direction. Rather, it demonstrates the purpose of a predefined price map: the same level can have different tactical significance depending on where price is trading relative to it and what the surrounding market structure is communicating.
8. Yesterday and Today: Buying the Discount Rather Than Shorting the Low
My approach yesterday and today therefore focused on a principle I repeatedly emphasize in volatile Gold markets:
Do not confuse a completed downside move with a new short opportunity.
Once XAU/USD had already travelled into and below the projected $4,269 region, the risk/reward characteristics had changed considerably from when Gold was trading at higher prices.
Instead of chasing the decline, I focused on buying beneath the mapped level and looking for recovery opportunities.
This is an important distinction between forecasting and execution. A forecast tells me where price could travel. Execution requires deciding what to do after it gets there.
The methodology therefore progressed logically:
Projection → Confirmation → Downside execution → Target achievement → Reassessment → Buying opportunity → Validation.
 9. Accuracy Means More Than Simply Hitting a Number
For me, analytical accuracy should not be reduced to saying that a price level was eventually touched.
There are several dimensions to accuracy.
The level must be projected before the move. The projection should have a verifiable timestamp. The market should subsequently reach the specified area. The trading methodology should explain how the level is intended to be used. Finally, the result should be documented without rewriting the original analysis after the event.
That is why the chronology surrounding $4,269 matters.
It allows the market itself to judge the projection.
The original downside map was established before the FOMC volatility. Gold subsequently reached and moved below that region. The strategy then evolved from selling higher prices toward the target to seeking buying opportunities after price moved beneath it.
That is a far more meaningful demonstration of methodology than simply publishing a successful chart after the move has finished.
10. Today’s Price Action: Let Correlations Confirm the Next Move
Following a major FOMC repricing, I continue to watch the same correlation framework rather than assuming that the previous day’s direction must continue.
If DXY and US Treasury yields strengthen together, rallies in XAU/USD require additional caution because the macro pressure on Gold remains present.
If Treasury yields begin declining while the Dollar simultaneously weakens, Gold has a stronger macro foundation for recovery.
USD/JPY provides another useful confirmation layer, particularly when movements in US rates and the Dollar are synchronized.
The key is not whether one indicator turns green or red. It is whether multiple independent markets begin telling the same story at the same time.
11. The $4,269 Case Study: Strategy, Precision and Performance
The September FOMC sequence represents the methodology I want my analysis to demonstrate.
$4,269 was mapped in advance on 14 September.
The Federal Reserve subsequently provided the macro catalyst.
Treasury yields and the Dollar helped explain the repricing.
Gold travelled into and through the projected region.
Selling from above the mapped destination captured the downside phase, while the strategy shifted toward buying after Gold moved below $4,269 rather than continuing to chase the market lower.
That sequence is what matters to me.
Markets will never provide certainty, and no analytical methodology can guarantee that every projected level will be achieved. What can be controlled is the process: define the level in advance, document it, monitor the correlations, wait for confirmation, manage execution around the mapped zone and objectively review the outcome afterward.
That is how I approach XAU/USD.
Not prediction after the event. Projection before the move.
Not permanent bullishness or bearishness. Price-dependent execution.
Not one isolated indicator. Multiple correlations and confluences.
And most importantly:
Project. Execute. Validate. Repeat.
— Piyush Ratnu
Quant Gold Strategist
XAU/USD Analysis • Algorithms • Research