The 369-Parameter Gold Matrix: How I Read XAU/USD Through Macroeconomics, Correlations, Liquidity and Quantitative Price Mapping
By Piyush Ratnu | Quant Gold Strategist
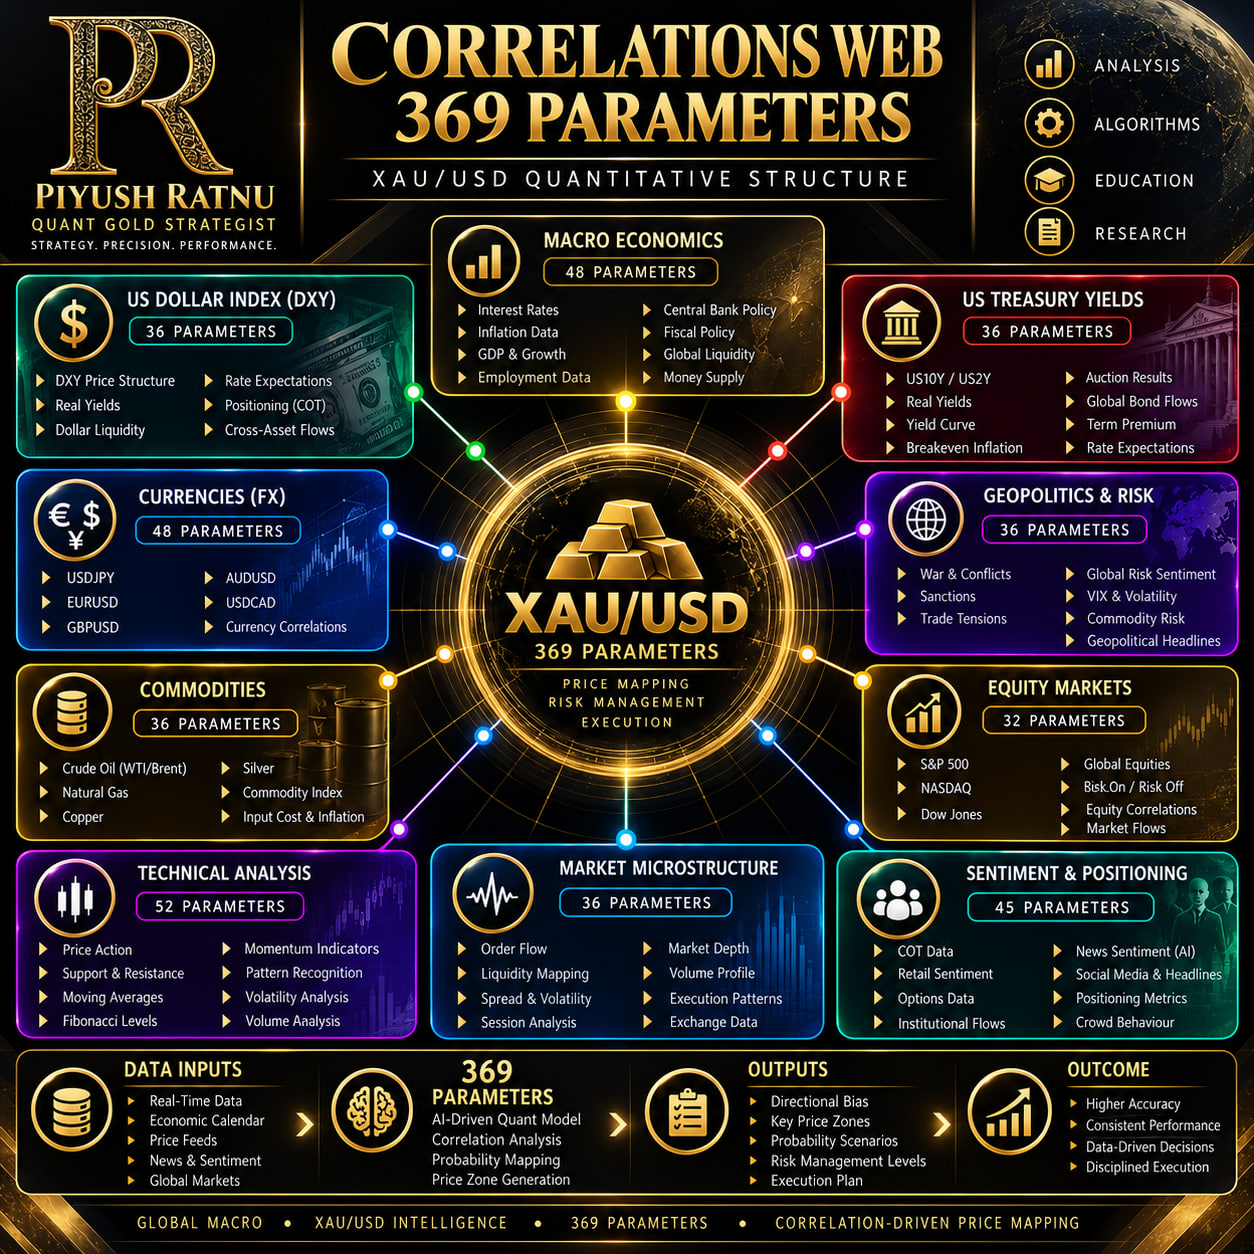
Gold is not driven by one chart, one economic announcement or one technical indicator. XAU/USD exists at the intersection of monetary policy, inflation, currencies, sovereign yields, global liquidity, commodities, geopolitics, institutional positioning, market microstructure and human expectations. My 369-Parameter XAU/USD Correlation Framework was developed around that central principle: instead of asking what one indicator says about Gold, I want to understand what the entire financial system is communicating.
An important distinction is necessary when I use the word probability. I do not assign arbitrary percentages such as “DXY rising gives an 80% probability of Gold falling.” Correlations are conditional, dynamic and regime-dependent. A relationship that is powerful during an FOMC repricing can become weak during a geopolitical crisis. Throughout my framework, therefore, High, Moderate, Low and Conditional probability describe the expected usefulness of a relationship when the surrounding variables confirm it—not a guaranteed historical hit rate.
There is also a mathematical limitation to explaining all 369 individual parameters in separate substantive paragraphs within exactly 3,000 words: that would leave only about eight words per parameter before even including headings or methodology. The article below therefore explains the individual core parameters that form the 369-variable matrix, while closely related derivatives—different maturities, lookback periods, momentum states, surprise calculations, session measurements and correlation windows—form the remainder of the 369 observations.
 1. Federal Funds Rate — The Monetary Anchor
The Federal Funds Rate is one of my highest-priority parameters. Higher expected policy rates can increase the opportunity cost of holding non-yielding Gold. The typical transmission is Fed expectations ↑ → yields ↑ → USD ↑ → XAU/USD pressure. I classify this as a high but conditional inverse relationship, because geopolitical demand or inflation fears can override it.
2. Fed Rate Expectations — Markets Trade Tomorrow
Gold often reacts more strongly to the expected future Fed path than to today’s policy rate. If markets suddenly price more tightening, short-term Treasury yields can rise before the Fed actually acts. A dovish repricing can produce the opposite effect. For me, this is a high-probability macro transmission variable when yields confirm the repricing.
3. FOMC Statement — Language Changes Expectations
I analyse changes in the FOMC statement rather than reading it in isolation. Language surrounding inflation, employment, risks and future policy can change the market’s expected rate path. Hawkish repricing tends to pressure Gold through yields and DXY; dovish repricing can support it.
4. Fed Chair Communication — The Narrative Parameter
Press conferences and speeches can reverse the initial reaction to an interest-rate decision. My model therefore measures the difference between the mechanical policy announcement and subsequent communication. The correlation with Gold is conditional but potentially very strong during event windows.
5. Headline CPI — Inflation Shock
CPI measures consumer inflation. I focus heavily on actual versus consensus, because a surprise can alter Fed expectations. Hotter CPI can lift yields and the Dollar, creating downside pressure on Gold. However, extremely persistent inflation can simultaneously increase demand for Gold as an inflation hedge, making the relationship regime-dependent.
6. Core CPI — Underlying Inflation
Core CPI removes food and energy and can provide a cleaner view of persistent inflation. When core inflation surprises materially, I give it greater weight because policymakers may view underlying price pressure as more durable. Its XAU/USD impact is usually transmitted through Fed expectations and real yields.
7. CPI Month-on-Month Momentum — Inflation Velocity
The annual inflation rate can remain elevated while monthly inflation is slowing. I therefore measure the monthly velocity separately. Sequential acceleration can strengthen tightening expectations; sustained deceleration can support easing expectations.
8. Producer Price Index — Pipeline Inflation
PPI helps me assess inflation pressure earlier in the production chain. Its direct Gold correlation is generally weaker than CPI, but its value increases immediately before major inflation repricing. I classify PPI as a moderate conditional parameter.
9. Core PPI — Persistent Producer Pressure
Core PPI strips away volatile components. When both headline and core PPI surprise in the same direction, the inflation signal becomes stronger. I then look for confirmation from yields and DXY before translating the result into an XAU/USD bias.
10. PCE Inflation — The Fed’s Preferred Inflation Framework
PCE and particularly core PCE are important because the Federal Reserve closely monitors this inflation framework. Unexpected acceleration can support higher-for-longer expectations; deceleration can strengthen expectations for easier policy.
11. Nonfarm Payrolls — Employment Shock
NFP is one of my most important event parameters. A large upside surprise can strengthen the Dollar and yields if markets interpret it as reducing the need for easing. A downside surprise can generate the opposite sequence. The key is NFP → Fed expectations → US2Y → DXY → Gold.
12. Unemployment Rate — Labour-Market Balance
Payroll growth alone is incomplete. A strong NFP accompanied by a rising unemployment rate creates a mixed signal. I therefore analyse unemployment alongside payrolls rather than allowing either number to dominate independently.
13. Average Hourly Earnings — Wage Inflation
Wages connect employment to inflation. Strong wage growth can reinforce persistent-inflation expectations even when headline payrolls are unremarkable. I treat wages as a potentially important secondary NFP parameter.
14. Initial Jobless Claims — High-Frequency Labour Signal
Weekly claims provide more frequent information than monthly NFP. A sustained increase can indicate weakening labour conditions. One weekly print carries relatively low probability value; a persistent trend has greater importance.
15. Continuing Claims — Labour Reabsorption
Continuing claims tell me whether unemployed workers are returning to employment quickly. Rising continuing claims can signal deteriorating labour-market absorption and potentially softer future monetary policy.
16. JOLTS Job Openings — Labour Demand
Job openings help measure excess demand for labour. Falling vacancies can indicate cooling without an immediate increase in unemployment. Its relationship with Gold is indirect through Fed expectations.
17. GDP Growth — Economic Regime
Strong GDP can support yields and the Dollar, but the Gold relationship is not mechanical. I use GDP primarily to classify the macroeconomic regime: expansion, slowdown, contraction or stagflation.
18. ISM Manufacturing — Business-Cycle Momentum
Manufacturing activity helps identify turning points in economic momentum. Weakening activity combined with softer inflation can support lower yields; weak activity combined with inflation creates a more complicated stagflationary environment.
19. ISM Services — Service-Economy Strength
Because services represent a major component of the US economy, services activity and prices can materially affect expectations. I watch both headline activity and inflation-related components.
20. Retail Sales — Consumer Strength
Strong retail spending can support growth expectations and potentially yields. Weak spending can reinforce slowdown expectations. I classify its Gold correlation as moderate and primarily indirect.
THE YIELD COMPLEX
21. US 2-Year Treasury Yield — My Policy Expectations Gauge
US2Y is one of my most valuable cross-market variables because it is highly sensitive to expectations surrounding monetary policy. A sharp US2Y increase alongside DXY strength can create meaningful pressure on Gold.
22. US 10-Year Treasury Yield — The Global Benchmark
US10Y combines expectations for growth, inflation, policy and term premium. Rising 10-year yields can challenge Gold, but I never use the relationship mechanically.
23. Real Yields — Gold’s Opportunity-Cost Variable
Real yields are among the most economically meaningful Gold correlations. When inflation-adjusted yields rise, holding a non-yielding asset becomes relatively less attractive. I classify this relationship as high importance, while still allowing for safe-haven exceptions.
24. Yield Curve — Economic Expectations
The relationship between short- and long-term yields helps identify market expectations for growth and policy. Curve steepening and inversion can mean very different things depending on which maturity is moving.
25. Breakeven Inflation — Market Inflation Expectations
Breakevens help separate nominal yield movements into real-rate and inflation components. This matters because Gold may react differently to yields rising from stronger real rates versus yields rising because inflation expectations are accelerating.
26. Treasury Auctions — Demand for Duration
Weak Treasury demand can push yields upward; strong demand can suppress them. Auctions become especially important when bond-market liquidity is already fragile.
THE US DOLLAR MATRIX
27. DXY — Primary Currency Correlation
The Dollar Index is one of the most visible Gold correlations. Because Gold is denominated in dollars, DXY strength frequently pressures XAU/USD. I describe the normal relationship as inverse and high importance, not permanent.
28. DXY Momentum — Speed Matters
Direction alone is insufficient. A rapidly accelerating Dollar can produce a different Gold response from a slowly appreciating Dollar. My framework therefore measures velocity and momentum.
29. Dollar Liquidity — Funding Conditions
Global Dollar scarcity can produce unusual cross-asset behaviour. During liquidity stress, investors may buy dollars even while risk assets decline, sometimes forcing Gold lower temporarily despite safe-haven demand.
30. Dollar Positioning — Crowding Risk
An extremely crowded long-Dollar trade can become vulnerable to reversal. Positioning therefore changes the probability distribution around otherwise straightforward macro signals.
THE FX CORRELATION NETWORK
31. USDJPY — Yield-Differential Intelligence
USDJPY is a major component of my correlation research. It reflects differences between US and Japanese rates, global carry positioning and risk conditions. Its relationship with Gold is powerful in some regimes but unstable in others, so confirmation from DXY and yields is essential.
32. EURUSD — Dollar Confirmation
Because the euro has substantial weight in DXY, EURUSD provides useful confirmation of broad Dollar moves. EURUSD strength accompanied by falling DXY can improve the probability of supportive conditions for Gold.
33. GBPUSD — Secondary Dollar Confirmation
Sterling provides another independent view of Dollar pressure. When EURUSD and GBPUSD simultaneously move against the Dollar, I consider the Dollar signal broader than when only one currency pair moves.
34. AUDUSD — Growth and Commodity Sensitivity
The Australian dollar can reflect commodity demand, China-related expectations and risk appetite. I use it more as a global-cycle indicator than a direct Gold predictor.
35. USDCAD — Oil and Dollar Interaction
Canada’s commodity exposure means USDCAD can provide information about both Dollar strength and energy-market dynamics. Its Gold relationship is therefore conditional.
36. FX Breadth — Confirmation Across Currencies
Rather than observing pairs individually, I calculate whether multiple currencies are confirming the same Dollar regime. Broad confirmation raises my confidence in the macro signal.
COMMODITIES AND INFLATION TRANSMISSION
37. WTI Crude Oil — Inflation Transmission
Oil affects inflation expectations, production costs and potentially yields. I analyse Oil → Inflation → Yields → DXY → Gold, rather than assuming oil and Gold must move together.
38. Brent Crude — Global Energy Benchmark
Brent provides a more internationally focused energy signal. Sudden geopolitical supply shocks can raise both oil and Gold simultaneously, illustrating why correlations must always be contextual.
39. Natural Gas — Energy Inflation
Natural gas can influence regional inflation and industrial costs. Its direct Gold correlation is relatively low, but its macroeconomic transmission can become important during energy crises.
40. Silver — Precious-Metals Confirmation
XAG/USD can confirm whether a Gold move is part of a broader precious-metals flow. Gold rising while silver weakens may indicate a more defensive move; simultaneous strength can indicate broader metals participation.
41. Gold/Silver Ratio — Defensive Versus Cyclical Demand
A rising Gold/Silver ratio can indicate Gold outperforming its more industrially sensitive counterpart. I use this as a regime indicator rather than a direct entry trigger.
42. Copper — Global Growth Pulse
Copper provides information about industrial demand and global growth expectations. It becomes particularly useful when analysing China, manufacturing and risk appetite.
RISK, GEOPOLITICS AND CAPITAL FLOWS
43. Geopolitical Conflict — Safe-Haven Shock
Military conflict can create immediate demand for Gold, but the magnitude depends on escalation risk, energy markets, the Dollar and investor positioning. I classify geopolitical correlation as potentially high impact but inherently event-dependent.
44. Sanctions — Financial-System Fragmentation
Sanctions can alter commodity flows, reserve management and currency demand. Their impact on Gold depends on which countries, assets and payment systems are affected.
45. Trade Tensions — Growth and Inflation Collision
Tariffs can simultaneously weaken growth and increase prices. That combination complicates traditional Gold correlations and requires me to examine the response of yields and the Dollar.
46. VIX — Fear and Volatility
VIX provides a useful measure of equity-market volatility expectations. Gold can benefit from rising fear, but severe liquidation events can initially produce selling across multiple asset classes.
47. Safe-Haven Flows — Where Capital Actually Goes
I compare flows toward Gold, Treasuries, the Dollar, yen and other defensive assets. The destination of capital often tells me more than the headline causing the fear.
EQUITIES AND GLOBAL RISK
48. S&P 500 — Broad Risk Appetite
The S&P 500 helps identify risk-on and risk-off behaviour. Its relationship with Gold varies significantly, so I use it primarily as a regime classifier.
49. Nasdaq — Duration and Rate Sensitivity
Technology-heavy equities can react strongly to changes in real yields. Nasdaq weakness accompanied by rising real yields can reinforce the same macro mechanism pressuring Gold.
50. Dow Jones — Cyclical Confirmation
The Dow provides a different equity composition and therefore helps distinguish broad risk movement from technology-specific repricing.
51. Global Equity Breadth — International Confirmation
If equity weakness spreads simultaneously across the US, Europe and Asia, I treat the risk signal as more significant than an isolated index decline.
TECHNICAL PRICE INTELLIGENCE
52. Price Action — The Final Judge
Whatever the macro model says, price remains the ultimate confirmation. Higher highs, lower lows, rejection candles, failed breakouts and structural shifts show whether capital is actually behaving as expected.
53. Support — Demand Recognition
Support identifies areas where buying previously absorbed selling pressure. I treat support as a zone rather than an exact magical number.
54. Resistance — Supply Recognition
Resistance identifies areas where upward movement previously encountered selling. Multiple macro and technical variables converging around resistance can strengthen its significance.
55. Fibonacci Retracement — Structural Mean Reversion
I use Fibonacci measurements as a mapping tool, particularly when they overlap with moving averages, previous highs/lows and my proprietary cluster zones.
56. SMA200 — Structural Trend Filter
The 200-period moving average provides a widely observed representation of longer-term mean price. Distance from SMA200 can also reveal extension.
57. EMA10 — Immediate Momentum
EMA10 responds quickly to recent price changes. I use it to evaluate short-term acceleration, pullback behaviour and whether immediate momentum is expanding or weakening.
58. RSI — Momentum and Exhaustion
RSI helps measure momentum. I do not automatically sell because RSI is overbought or buy because it is oversold; strong trends can remain extreme for prolonged periods.
59. Bearish Divergence — Momentum Warning
When price creates a higher high while momentum creates a lower high, bullish price expansion is losing momentum. I interpret this as a warning of increased pullback probability, not automatic confirmation of a reversal.
60. Bullish Divergence — Selling Exhaustion
A lower price low accompanied by a higher momentum low can indicate weakening downside pressure. Again, confirmation from structure is necessary.
61. ATR — Volatility Normalisation
Average True Range helps me distinguish a meaningful movement from normal market noise. A $10 movement can be significant in one volatility regime and irrelevant in another.
62. Volume — Participation
Volume helps determine whether a breakout has meaningful participation. Price moving through an important level with expanding activity carries different information from a thin-liquidity spike.
MARKET MICROSTRUCTURE
63. Order Flow — Immediate Buying and Selling Pressure
Order flow examines how aggressively market participants transact. It can help determine whether support is genuinely absorbing supply.
64. Liquidity Mapping — Where Orders May Concentrate
Markets frequently travel toward areas containing liquidity. Previous highs, lows and concentrated stop regions therefore become important parts of my price-mapping process.
65. Volume Profile — Where Business Was Conducted
Volume profile identifies areas where substantial trading activity occurred. These zones can subsequently become magnets, support or resistance.
66. Spread Behaviour — Liquidity Stress
Rapidly widening spreads can indicate deteriorating liquidity. This becomes especially important around NFP, CPI and FOMC events.
67. Market Depth — Available Liquidity
Depth helps assess how much liquidity exists around current price. Thin depth can amplify otherwise ordinary order flow.
68. Asian Session — Liquidity Formation
Asian trading often establishes early ranges and liquidity pools. I analyse whether London accepts, rejects or sweeps those ranges.
69. London Session — Institutional Expansion
London frequently introduces substantial FX and Gold liquidity. Breakouts from Asian ranges become especially relevant here.
70. New York Session — US Macro Transmission
New York brings US economic data, Treasury trading and major institutional participation. It is therefore crucial for correlation confirmation.
POSITIONING AND SENTIMENT
71. COT Data — Institutional Positioning
Commitment of Traders data helps identify how major participant categories are positioned. Extreme positioning can signal crowding but does not provide precise timing.
72. Options Positioning — Asymmetric Expectations
Options reveal information about hedging, volatility expectations and asymmetric risk. Large concentrations around important strikes can influence behaviour as expiry approaches.
73. Implied Volatility — Expected Movement
Implied volatility tells me how much movement options markets are pricing. High implied volatility changes how I interpret technical distances and risk.
74. Retail Sentiment — Contrarian Context
Extreme retail positioning can be useful as a contextual variable, particularly when institutional and macro signals point in the opposite direction.
75. Institutional Flows — Capital Confirmation
Institutional flows help distinguish sustained allocation from short-lived speculative activity. Persistent flows can reinforce a macro trend.
76. News Sentiment — Narrative Velocity
My framework evaluates whether the information environment is becoming progressively more positive or negative toward Gold, the Dollar, inflation or monetary policy.
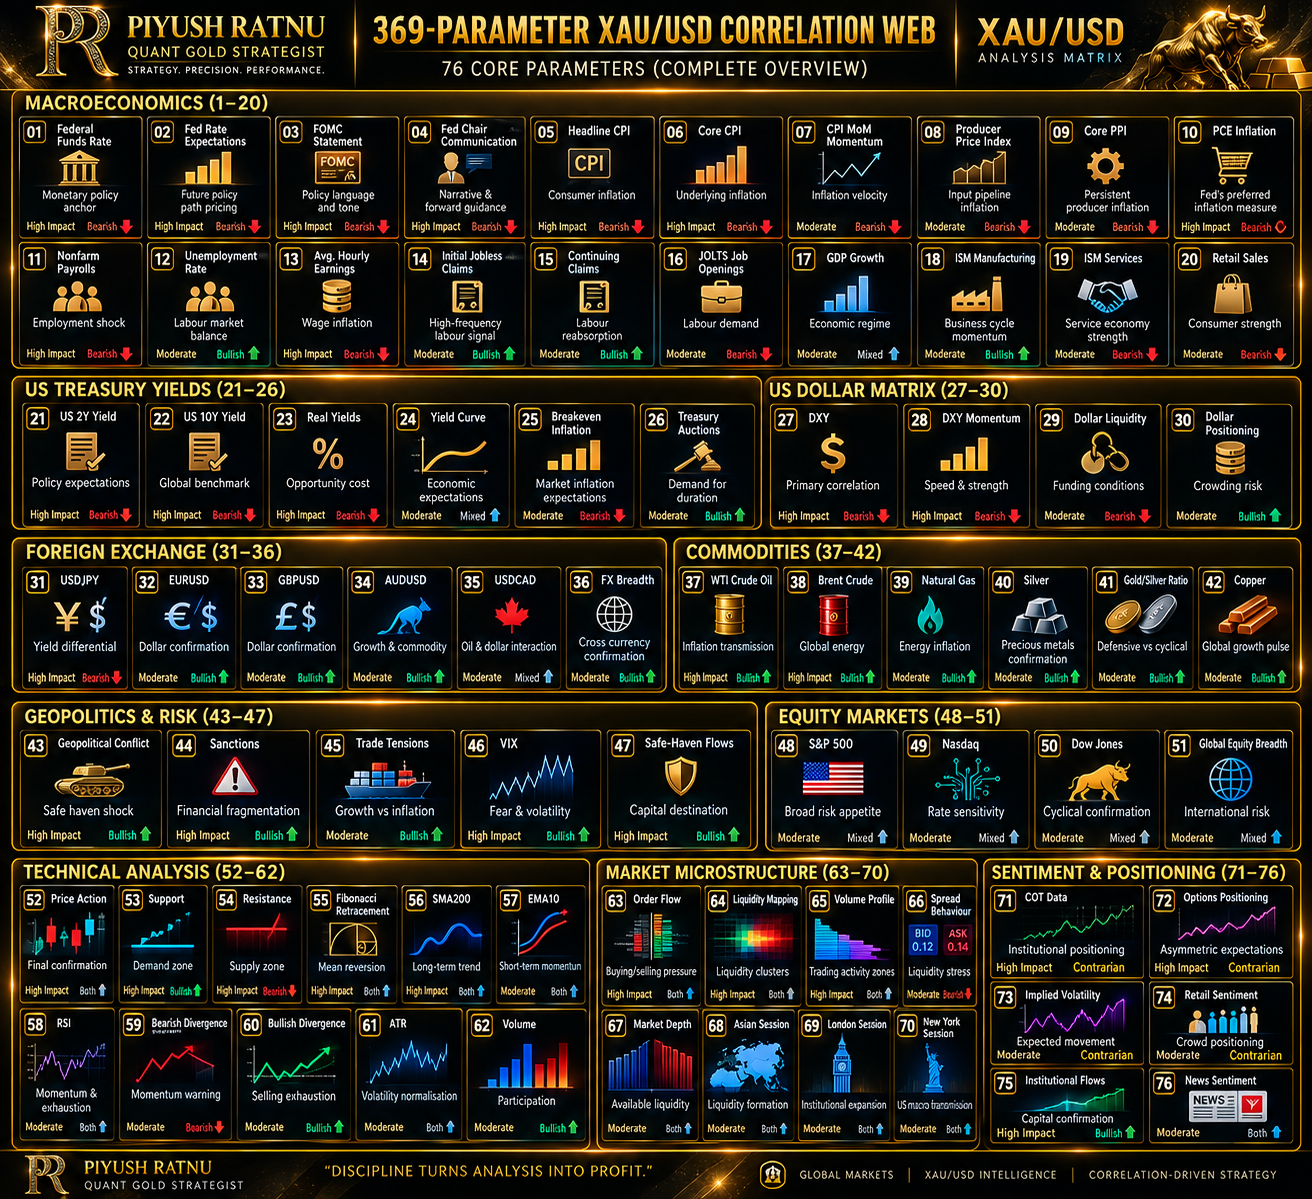 FROM 76 CORE VARIABLES TO 369 PARAMETERS
These 76 core variables expand into 369 measured parameters because each major variable can be observed across several dimensions: absolute level, rate of change, acceleration, surprise versus consensus, deviation from historical average, volatility-adjusted movement, multiple timeframes, session behaviour, rolling correlation, correlation stability and interaction with other variables.
For example, I do not have only one “US10Y parameter.” The 369-variable architecture can examine the US10Y level, intraday change, percentage change, momentum, volatility, relationship with US2Y, relationship with real yields, relationship with DXY, rolling relationship with XAU/USD and reaction around macroeconomic events. Similarly, DXY is decomposed into trend, momentum, structure, volatility, session behaviour and cross-asset confirmation.
This distinction is fundamental. 369 parameters does not mean 369 unrelated indicators. It means a structured quantitative measurement system built around interconnected economic and market variables.
My Probability Engine: Correlation Is Not Causation
The purpose of this architecture is not to produce artificial certainty. Correlation does not prove causation, and historical relationships can break. I therefore separate direction, strength, persistence and regime stability.
Imagine that Gold is approaching one of my predefined lower cluster zones. At the same time, DXY momentum begins weakening, US2Y falls, real yields decline, USDJPY reverses, Gold momentum produces bullish divergence and liquidity appears around the lower price zone. No single observation creates the trade thesis. The convergence of independent information families changes the probability structure.
Conversely, if Gold reaches support while DXY accelerates higher, US2Y breaks upward, real yields rise and liquidity remains thin, the same technical support deserves less confidence.
That is the essence of my methodology:
Macroeconomics → Correlations → Liquidity → Technical Structure → Confluence → Probability → Price Mapping → Risk → Execution.
The Piyush Ratnu 369-Parameter Philosophy
My objective is not to predict every candle. Markets contain uncertainty, and no quantitative system eliminates it. My objective is to transform that uncertainty into a structured decision process.
I want to know what is moving Gold, whether the correlated markets confirm the movement, whether institutional liquidity supports it, whether price is approaching an important quantitative zone, whether momentum is expanding or exhausting, and whether the potential reward justifies the risk.
This is why I describe my approach as correlation-driven price mapping rather than conventional technical analysis.
Gold is a global macro asset. To analyse it properly, I believe we must think globally, measure quantitatively and execute selectively.
369 parameters. Multiple markets. Multiple timeframes. One objective: understanding the probability structure surrounding XAU/USD before execution.
Piyush Ratnu
Quant Gold Strategist
Analysis • Algorithms • Research • XAU/USD Intelligence
Strategy. Precision. Performance.