
As projected on 19.10.2023, 30.10.2023 and 13.11.2023 and as mentioned many times: buying on 14.11.2023 at CMP is always a GOOD IDEA, as traced since last 7 years.
At $1926 zone: BUYING was indicated through our algorithm based analysis indicating 2007 and 2080 zone as crucial resistance.
XAUUSD crossed the resistance zone of $2009 on 24.11.2023, and is now struggling at $2048 zone, all set to breach $2069 and $2080 zones.
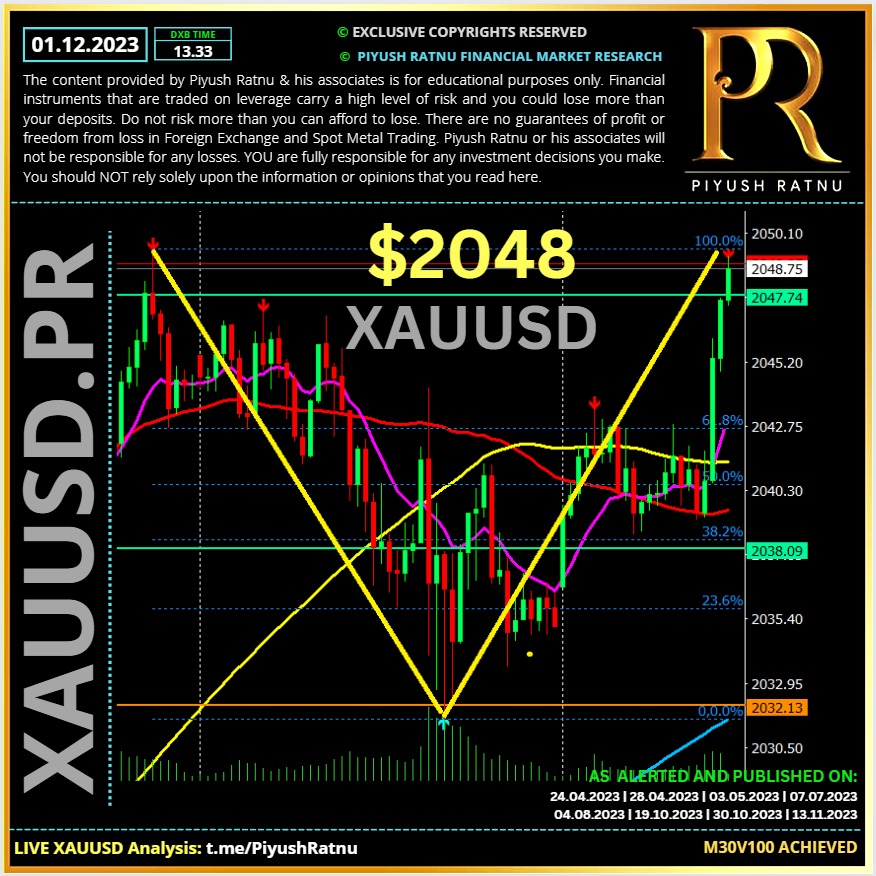
As mentioned earlier: I would prefer to SHORT highs as technical and volumes correction awaits ahead, just like every first week of December. Looks like ideal exit zones to me.
Gold price is flirting with a fresh six-month high of $2,052 reached earlier in the Asian session on Wednesday, extending its winning streak into the fifth straight day.
In the absence of top-tier US economic data so far this week, Gold price remained at the mercy of the Fedspeak and risk sentiment, which intensified the bearish momentum in the United States Dollar (USD) and US Treasury bond yields across the curve.
The US Dollar is languishing in three-month troughs against its major counterparts early Wednesday, keeping Gold price elevated at a half-year peak near mid-$2,050. The US Dollar Index refreshed a three-month low at 102.47 after the benchmark 10-year US Treasury bond yield extended its sell-off to reach 4.27%, the level last unseen since September 15.
All eyes will turn toward Thursday’s Personal Consumption Expenditures – Price Index data and the Eurozone inflation data for a fresh take on the major central banks’ interest rate expectations. On Friday, Fed Chair Jerome Powell’s speech will hog the limelight, as it will be his last appearance before the Fed’s ‘blackout period’ begins on Saturday, ahead of the 🆘December 12-13 policy meeting.
🟢 Technical Approach:
On the upside, acceptance above the multi-month high of $2,054 will fuel a fresh uptrend toward the $2,069/2089 static resistance. Immediate support is seen at the mid-September highs of ⏰$2019, which was earlier an important resistance.
The next critical downside cap is expected to be at $2009, below which the corrective momentum could regain traction for a test of the ⏰$2,000 threshold. The last line of defense for Gold buyers would be the upward-pointing 21-day Simple Moving Average (SMA) at ⏰$1,985-1966 zone.
VERIFY at: https://t.me/PiyushRatnu/7157