How to Trade XAU/USD Safely Before and After FOMC: A Probability & Correlation-Based Framework by Piyush Ratnu
XAUUSD: $4040 OR $4646 After FOMC?
The biggest mistake Gold traders make after an FOMC meeting is reacting to the headline rather than the underlying market correlations. While the Federal Reserve’s interest rate decision attracts the most attention, the real drivers of XAU/USD are the market’s interpretation of future liquidity, Treasury yields, the US Dollar, and risk sentiment.
The Four Correlations That Matter Most
1. US Dollar Index (DXY)
Gold maintains a strong inverse relationship with the US Dollar.
- DXY Rising = Gold Bearish
- DXY Falling = Gold Bullish
A post-FOMC decline in DXY typically signals that markets expect easier monetary conditions ahead, which supports Gold prices.
2. US 10-Year Treasury Yield
Gold is a non-yielding asset.
- Yields Rising = Gold Bearish
- Yields Falling = Gold Bullish
Watch the reaction of real yields rather than the nominal rate decision itself.
3. Liquidity Expectations
Gold performs best when markets anticipate:
- Rate cuts
- Balance sheet expansion
- Slower quantitative tightening
- Increased financial system liquidity
Gold struggles when liquidity is expected to contract.
4. Geopolitical Risk Premium
Safe-haven demand increases during:
- Middle East tensions
- Military escalation
- Energy supply disruptions
Safe-haven demand decreases when diplomatic solutions emerge.
 What is the Fed Dot Plot?
The Dot Plot is a chart released by the Federal Reserve every quarter as part of the Summary of Economic Projections (SEP).
Each dot represents one FOMC member’s expectation for the Federal Funds Rate at the end of:
- Current year
- Next year
- Following year
- Longer run
The market focuses primarily on the median dot, because it shows where the majority of policymakers expect rates to be.
Example
If today’s Fed Funds Rate is 3.75%:
| Dot Plot Median | Market Interpretation |
|---|---|
| 3.50% | 1 rate cut expected |
| 3.75% | No change expected |
| 4.00% | 1 rate hike expected |
| 4.25% | 2 hikes expected |
Why Does the Dot Plot Matter?
Markets are forward-looking.
Gold, Bonds, Stocks, DXY and USDJPY all react not to today’s rate but to where traders think rates will be in the future.
The Dot Plot changes those expectations instantly.
Impact on Interest Rates
Hawkish Dot Plot
If the median dots move higher:
Current:
- 2026 = 3.75%
New:
- 2026 = 4.25%
Market interpretation:
✅ Higher rates for longer
Result:
- Treasury yields rise
- Bond prices fall
Dovish Dot Plot
Current:
- 2026 = 3.75%
New:
- 2026 = 3.25%
Market interpretation:
✅ Rate cuts coming
Result:
- Treasury yields fall
- Bond prices rise
Impact on US Dollar (DXY)
Hawkish Dot Plot
Higher rates attract global capital.
Investors buy USD to earn higher yields.
Result:
| Asset | Reaction |
|---|---|
| DXY | Bullish |
| USDJPY | Bullish |
| EURUSD | Bearish |
| GBPUSD | Bearish |
Dovish Dot Plot
Lower rates reduce USD attractiveness.
Result:
| Asset | Reaction |
|---|---|
| DXY | Bearish |
| USDJPY | Bearish |
| EURUSD | Bullish |
| GBPUSD | Bullish |
 Impact on Gold (XAUUSD)
Gold has no yield.
Therefore Gold competes directly against interest-bearing assets.
Hawkish Dot Plot
Sequence:
Higher Dots → Higher Yields → Stronger USD → Gold Falls
Typical reaction:
| Correlation | Impact |
|---|---|
| DXY ↑ | Gold ↓ |
| US10Y ↑ | Gold ↓ |
| Real Yields ↑ | Gold ↓ |
Probability: ≈ 70-80% bearish for Gold
Dovish Dot Plot
Sequence:
Lower Dots → Lower Yields → Weaker USD → Gold Rises
Typical reaction:
| Correlation | Impact |
|---|---|
| DXY ↓ | Gold ↑ |
| US10Y ↓ | Gold ↑ |
| Real Yields ↓ | Gold ↑ |
Probability: ≈ 70-80% bullish for Gold
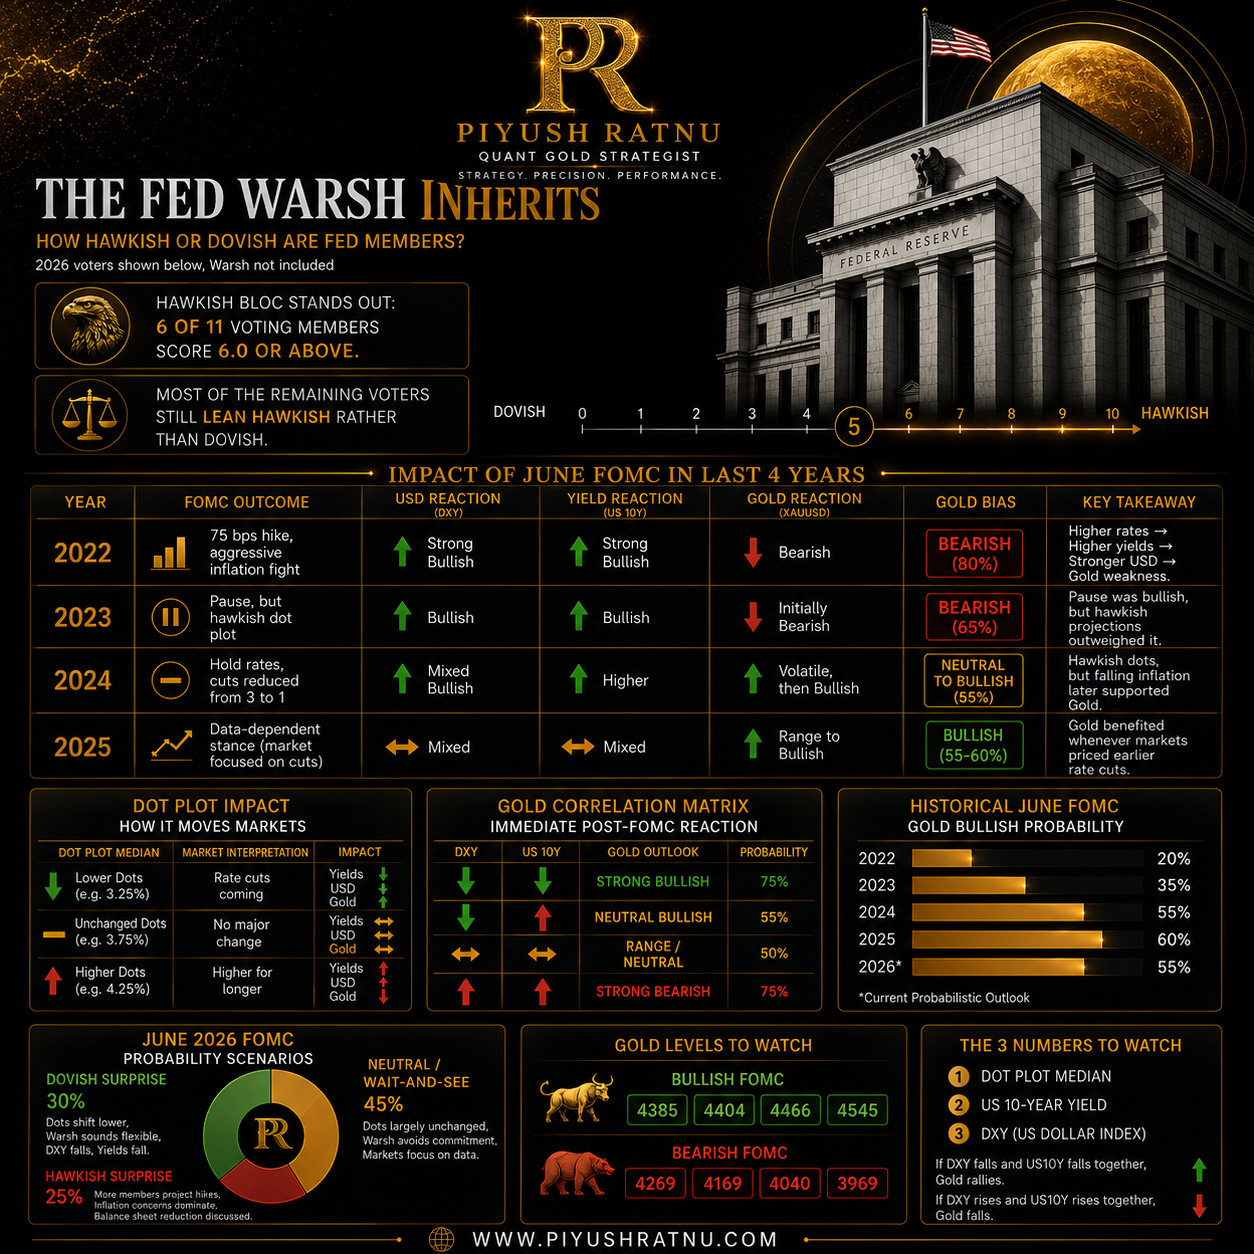
June FOMC Impact on Gold (XAUUSD): Last 4 Years Review
For Gold traders, the June FOMC is often one of the most important meetings of the year because it includes updated economic projections and the Fed’s Dot Plot. The reaction is usually driven by changes in future rate expectations rather than the actual rate decision.
| Year | FOMC Outcome | USD Reaction | Yield Reaction | Gold Reaction |
|---|---|---|---|---|
| 2022 | 75 bps hike, aggressive inflation fight | Strong Bullish | Strong Bullish | Bearish |
| 2023 | Pause, but hawkish dot plot | Bullish | Bullish | Initially Bearish |
| 2024 | Hold rates, cut projections reduced from 3 to 1 | Mixed Bullish | Higher | Volatile, then Bullish |
| 2025 | Data-dependent stance (market focused on cuts) | Mixed | Mixed | Range to Bullish |
June 2022 FOMC
Fed Message
- Fed delivered a 75 bp hike.
- Inflation was the primary concern.
- Markets priced a more aggressive tightening cycle.
Market Impact
- DXY rallied sharply.
- Treasury yields surged.
- Gold sold off as real yields moved higher.
Gold Takeaway
Probability Environment: 80% Bearish
Higher rates → Higher yields → Stronger USD → Gold weakness.
June 2023 FOMC
Fed Message
- First pause after a long hiking cycle.
- Dot Plot signaled additional hikes despite the pause.
- Most policymakers still expected higher rates later in the year.
Market Impact
- Dollar strengthened.
- Yields moved higher.
- Gold initially dropped after the hawkish dot plot.
Gold Takeaway
Probability Environment: 65% Bearish
The pause itself was bullish for Gold, but the hawkish projections outweighed the pause.
June 2024 FOMC
Fed Message
- Rates unchanged.
- Dot Plot reduced expected 2024 cuts from 3 to 1.
- Fed signaled inflation remained sticky.
Market Impact
- Bond yields rose.
- USD remained firm.
- Gold experienced volatility but recovered as inflation softened later in June.
Gold Takeaway
Probability Environment: Neutral to Slightly Bullish
Despite the hawkish dots, falling inflation eventually supported Gold.
June 2025 FOMC
Fed Message
- Market focused on timing of future cuts.
- Fed emphasized data dependency.
- Inflation trends became more important than rate hikes.
Market Impact
- DXY traded mixed.
- Yields stabilized.
- Gold maintained a constructive medium-term trend.
Gold Takeaway
Probability Environment: 55-60% Bullish
Gold benefited whenever markets priced earlier rate cuts.
Historical June FOMC Pattern
What History Suggests for June 2026
The current setup resembles June 2023 more than June 2024:
Similarities
- Inflation remains elevated.
- Labor market remains resilient.
- Fed committee remains hawkish.
- Dot Plot is more important than the rate decision itself.
Key Difference
Kevin Warsh is a new Chair.
Markets are not only pricing rates but also trying to understand:
- His inflation tolerance.
- His stance on balance sheet policy.
- Whether he supports future hikes or future cuts.
 PR Quant Gold View
Based on:
- Hawkish voter distribution (6 of 11 clearly hawkish).
- Current inflation concerns.
- Market expectations already pricing a hold.
Most Probable Outcome
| Scenario | Probability |
|---|---|
| Neutral / Wait-and-See | 45% |
| Dovish Surprise | 30% |
| Hawkish Surprise | 25% |
Gold Levels
Bullish FOMC
- 4385
- 4404
- 4466
- 4545
Bearish FOMC
- 4269
- 4169
- 4040
- 3969
The Number to Watch
Not the rate decision.
Watch:
- Dot Plot Median
- US10Y Yield
- DXY
If DXY falls and US10Y falls together, Gold historically produces its strongest post-FOMC rallies.
If DXY rises and US10Y rises together, Gold historically experiences its deepest post-FOMC declines.
——————————————————————————
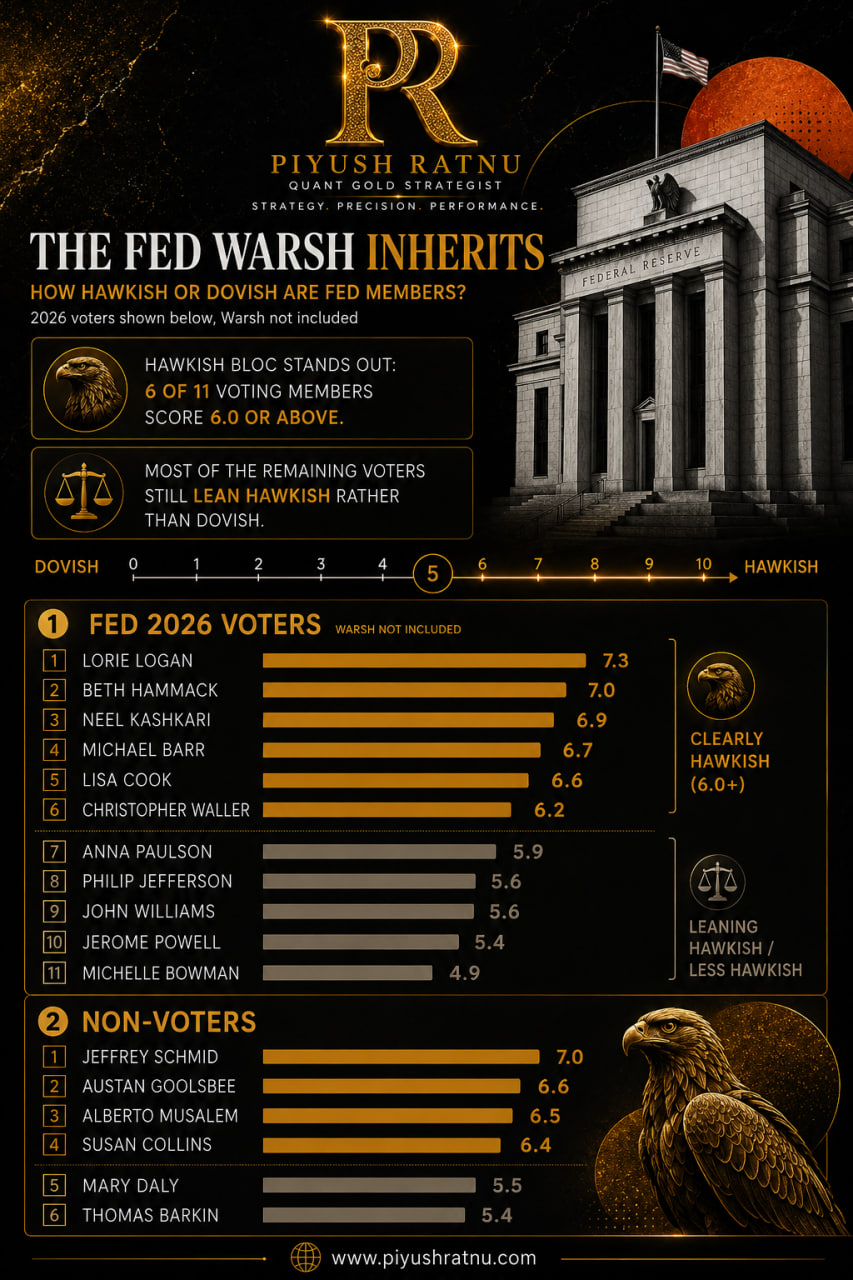
Why Kevin Warsh Makes This FOMC Different
The market already expects:
- No rate change
- Fed Funds Rate 3.50%-3.75%
The bigger question is:
Will Warsh’s Dot Plot show future hikes or future cuts?
The committee remains predominantly hawkish.
From the chart:
Voting Members
| Hawkish Score |
|---|
| Lorie Logan |
| Beth Hammack |
| Neel Kashkari |
| Michael Barr |
| Lisa Cook |
| Christopher Waller |
6 of 11 voters score above 6.0.
This means the committee bias remains tilted toward inflation control.
Gold Probability Matrix for This FOMC
XAUUSD probability after FOMC
Illustrative probability scenarios based on dot plot and Fed tone.0%20%40%60%80%Dovish Dot PlotNeutral Dot PlotHawkish Dot Plot
Scenario 1: Dovish Surprise (30%)
- Dot Plot shifts lower
- Warsh sounds flexible
- DXY falls
- Yields fall
Gold targets:
- 4385
- 4404
- 4466
- 4545
Scenario 2: Neutral / Wait-and-See (45%)
- Dots largely unchanged
- Warsh avoids commitment
- Markets focus on data
Gold likely remains between:
- 4269
- 4404
Scenario 3: Hawkish Surprise (25%)
- More members project hikes
- Inflation concerns dominate
- Balance sheet reduction discussed
Gold targets:
- 4269
- 4169
- 4040
- 3969
The Most Important Correlation to Watch
Immediately after the Dot Plot release:
- Watch US 10-Year Yield first.
- Watch DXY second.
- Then trade Gold.
A simple institutional rule:
- DXY ↓ and US10Y ↓ = Buy Gold rallies.
- DXY ↑ and US10Y ↑ = Sell Gold rallies.
- Mixed signals = Avoid chasing volatility.
Bottom Line
The rate decision itself is unlikely to move Gold significantly because it is largely priced in. The Dot Plot and Warsh’s press conference are the real market movers. If the median dots shift toward future hikes, Gold faces downside pressure through stronger yields and a stronger Dollar. If the dots shift toward cuts or Warsh sounds less concerned about inflation, Gold could extend its recovery toward the 4389–4450 resistance zone.
 FOMC Trading Logic
The market is currently less focused on the actual rate decision and more focused on how Kevin Warsh frames future policy.
Bullish Gold Outcome (Probability: 55%)
Conditions:
- Rates unchanged
- Dovish tone
- Concern about growth
- Slower balance sheet reduction
- DXY weakens
- Treasury yields decline
Expected reaction:
| Asset | Expected Move |
|---|---|
| DXY | ↓ |
| US10Y | ↓ |
| Equities | ↑ |
| Gold | ↑ |
Potential Gold targets:
- 4444
- 4488
- 4545
- 4585
Bearish Gold Outcome (Probability: 45%)
Conditions:
- Hawkish hold
- Higher-for-longer narrative
- Hawkish SEP
- Dot plot shifts toward hikes
- Balance sheet reduction discussed
Expected reaction:
| Asset | Expected Move |
|---|---|
| DXY | ↑ |
| US10Y | ↑ |
| Equities | ↓ |
| Gold | ↓ |
Potential downside targets:
- 4269
- 4169
- 4040
- 3969
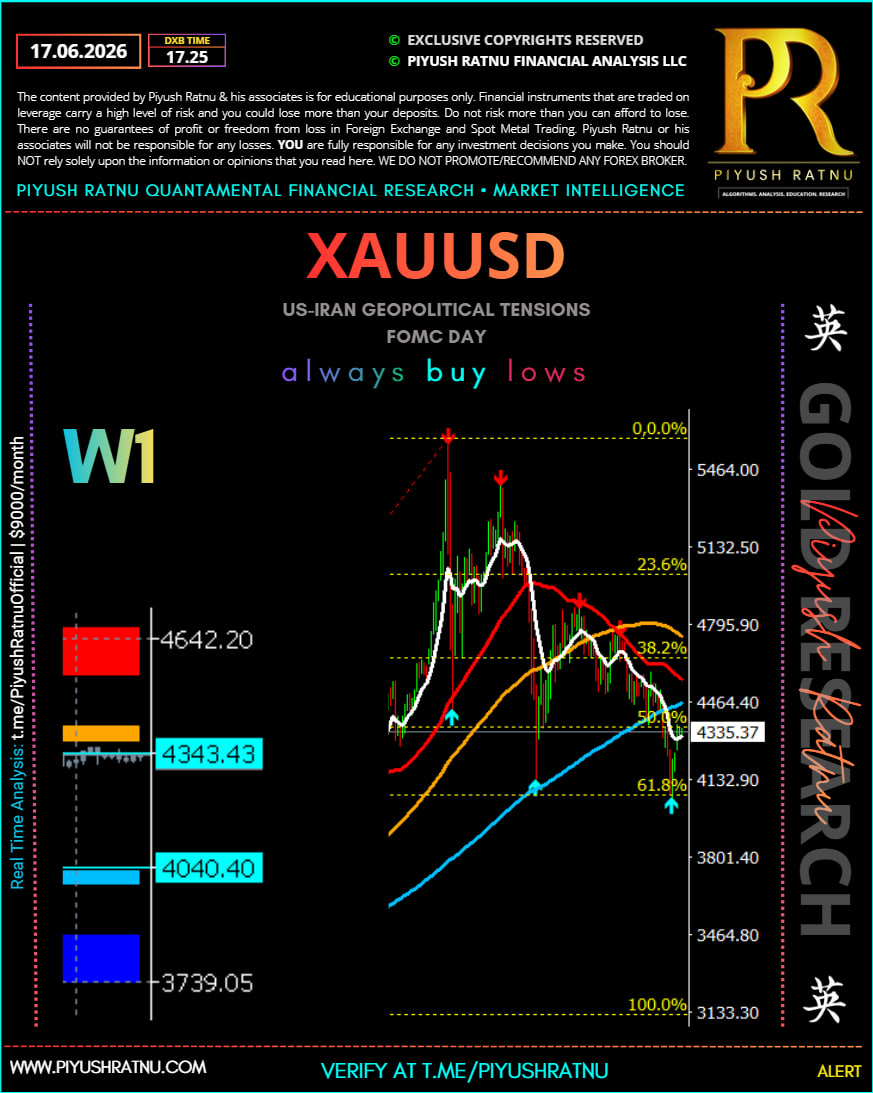
Technical Analysis of Attached Chart
Murray Math Structure
The chart shows a completed decline from:
4727 → 4020
Key Murray/Fibonacci levels visible:
| Level | Price |
|---|---|
| 100% | 4677 |
| 61.8% | 4404 |
| 50.0% | 4314 |
| 38.2% | 4259 |
| 23.6% | 4179 |
| 0.0% | 4049 |
Current price: ≈ 4330
Current Position
Price has already:
✅ Reclaimed 23.6%
✅ Reclaimed 38.2%
✅ Reclaimed 50%
Now testing the 50%-61.8% resistance cluster.
This is the most important decision zone on the chart.
Fair Value Gap (FVG) Analysis
A large bearish imbalance remains between:
FVG Zone
4389 – 4405
This zone aligns with:
- 61.8% retracement
- Murray resistance
- Previous breakdown structure
- Dynamic MA resistance
Institutional traders will likely target this imbalance before deciding on the next major move.
Bullish Scenario
Probability: 60%
Requirements:
- DXY below 97
- US10Y below 4.20%
- FOMC not aggressively hawkish
- Daily close above 4314
Targets:
| Target | Probability |
|---|---|
| 4385 | 80% |
| 4404 | 70% |
| 4444 | 55% |
| 4545 | 35% |
A break above 4404 would indicate that the correction from 4727 is likely over and a broader retracement toward 4545 becomes probable.
Bearish Scenario
Probability: 40%
Triggers:
- DXY strengthens sharply
- Treasury yields rise
- Warsh signals tighter policy
- Rejection from 4389-4405
Targets:
| Target | Probability |
|---|---|
| 4269 | 85% |
| 4169 | 65% |
| 4040 | 45% |
| 3939 | 25% |
A rejection from the FVG and 61.8% resistance would create a classic bearish continuation setup.
Correlation Matrix for FOMC
| DXY | US10Y | Gold Probability |
|---|---|---|
| ↓ | ↓ | Strong Bullish (75%) |
| ↓ | ↑ | Neutral Bullish (55%) |
| ↑ | ↓ | Range Market (50%) |
| ↑ | ↑ | Strong Bearish (75%) |
Summary
The chart currently favors a recovery phase rather than an immediate collapse. The 4389-4405 zone is the key institutional decision area where Murray Math resistance, Fair Value Gap imbalance, and the 61.8% retracement converge. As long as Gold remains above 4259, the probability slightly favors a continuation toward 4389-4405 (≈60%). A hawkish FOMC combined with rising DXY and Treasury yields would shift probabilities back toward 4259, 4179, and potentially the 4049 low.