
How to trade XAUUSD accurately and safely on FOMC US Interest Rate Day 29 April 2026?
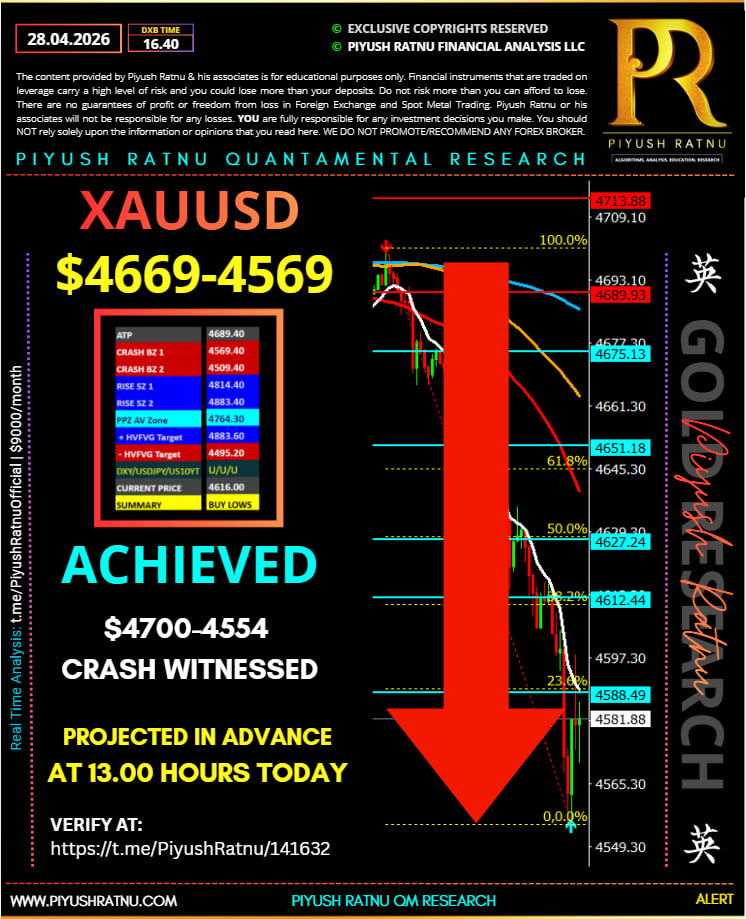
 WHAT HAPPENED yesterday (28.04.2026) and why?
Verify at:
🔴https://t.me/PiyushRatnu/141632
🔴https://www.instagram.com/p/DXrC8YmiKON/
🔴https://x.com/piyushratnu/status/2049051407375110653
Why XAUUSD price crashed on 28 April 2026?
Gold came under intense selling pressure on Tuesday as the Oil price surge resumed on the back of the continued stand-off between the United States (US) and Iran, especially after US President Donald Trump expressed his displeasure with the new Iranian proposal toward ending the war.
Additionally, the United Arab Emirates’ (UAE) decision to leave OPEC and OPEC+ after nearly six decades also contributed to the renewed upside in the black gold.
Correlation: OIL+ USDJPY+ DXY+ US10YT+ = XAUUSD (-)
🔶 Policy Paralysis Meets Geopolitical Drift: Gold Stuck in a Pre-Fed Range
Gold (XAUUSD) continues to oscillate around the $4,700 level, trapped in a familiar consolidation band as markets await clarity from the upcoming Federal Reserve policy decision. The lack of directional conviction reflects a broader macro hesitation, where traders are unwilling to commit aggressively ahead of key event risk. At the same time, a gradual recovery in the US Dollar—driven by cautious sentiment—has capped upside attempts in gold, reinforcing a controlled, range-bound environment.
🌍 Geopolitical Uncertainty: US–Iran Dynamics Keep Risk Premium Alive
Ongoing developments between the United States and Iran continue to inject uncertainty into the market. Discussions around a potential resolution remain inconclusive, with mixed signals from officials keeping geopolitical risk elevated. The unresolved situation surrounding the Strait of Hormuz sustains a mild safe-haven bid in the Dollar, indirectly limiting gold’s upside. This creates a paradox where geopolitical risk supports gold structurally, but near-term USD strength suppresses price.
🏦 Central Bank Crosscurrents: Fed Focus with BoJ Spillover Risk
Markets are positioning ahead of multiple central bank signals, led by the Fed decision and supported by expectations from the Bank of Japan. While both are expected to hold rates steady, the forward guidance—particularly from Fed Chair Jerome Powell—remains the key catalyst. Additionally, leadership transition uncertainty within the Fed adds another layer of hesitation. Any surprise from BoJ policy could trigger USD/JPY volatility, creating secondary effects on the Dollar and, by extension, gold.
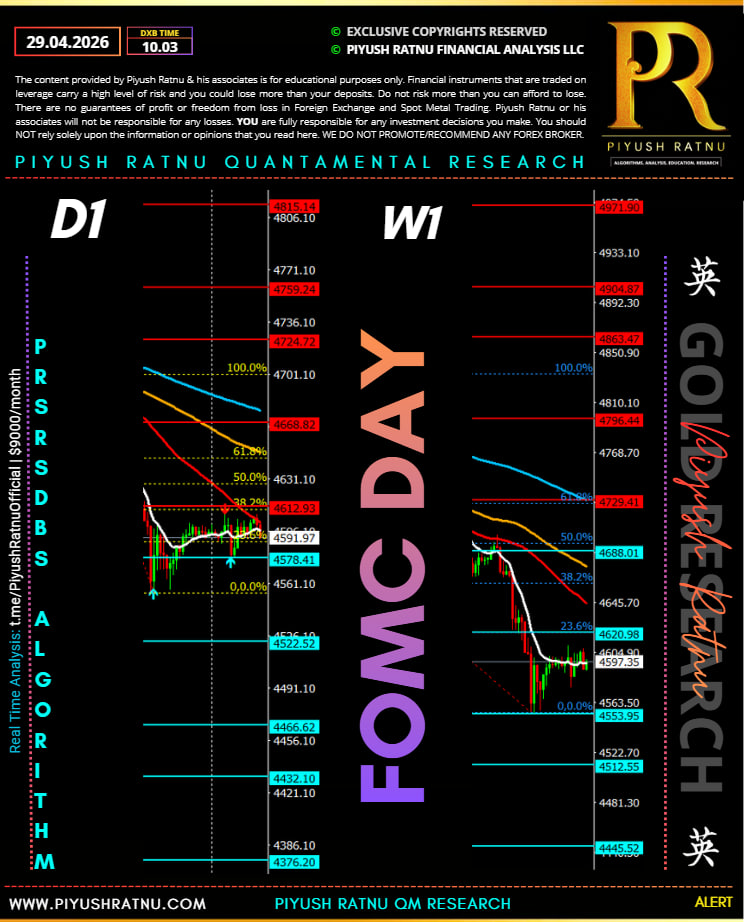
📉 Technical Structure: Descending Channel Caps Upside
From a structural standpoint, gold remains confined within a well-defined descending channel. Each attempt to test the upper boundary has been met with selling pressure, reinforcing the bearish bias in the short term. The Relative Strength Index (RSI) remains weak, suggesting limited momentum for a sustained breakout. As long as price trades below channel resistance, rallies are likely to be corrective rather than impulsive.
⚖️ Market Positioning: Compression Before Expansion
Current price behavior reflects a classic “pre-event compression” phase. Volatility is subdued, ranges are tight, and liquidity is building on both sides of the market. Profit-taking flows and cautious positioning ahead of the Fed decision are preventing any decisive move. This environment typically precedes a volatility expansion, where the eventual breakout direction is dictated by policy guidance and macro alignment.
 📊 XAUUSD Correlation & Correction Probability Matrix (PR Quant Model)
| Factor | Current Bias | Correlation with Gold | Impact Strength | Correction Probability | PR Interpretation |
|---|---|---|---|---|---|
| DXY (US Dollar Index) | Gradual Strength | Inverse (-) | ⭐⭐⭐⭐ | 65% downside pressure | USD bid capping gold upside |
| US Real Yields | Stable / Slightly Up | Strong Inverse (-) | ⭐⭐⭐⭐⭐ | 60% correction risk | Higher yields reduce gold appeal |
| Geopolitical Risk (US–Iran) | Elevated | Positive (+) | ⭐⭐⭐ | 45% support factor | Limits deep downside |
| Fed Policy Expectation | Hold / Uncertain | Mixed | ⭐⭐⭐⭐⭐ | 70% volatility trigger | Direction depends on guidance |
| BoJ Policy / USDJPY | Neutral | Indirect | ⭐⭐ | 30% secondary effect | Spillover risk only |
| Technical Structure (Channel) | Bearish | Direct | ⭐⭐⭐⭐ | 68% rejection near resistance | Sell on rallies bias |
| Market Positioning | Neutral | Mixed | ⭐⭐⭐ | 50% range continuation | Compression phase |
🧠 STRUCTURE SNAPSHOT (PR + Murray + Fib Confluence)
| Zone | Level | PR Cluster Logic | Murray/Fib Role | Market Behavior |
|---|---|---|---|---|
| 🔴 Extreme High | 5757 | Blow-off / exhaustion cluster | 0/8 overshoot | Panic top liquidity |
| 🔴 Supply Zone | 5454 – 5555 | Rejection cluster (previous spike highs) | +2/8 | Smart money sell zone |
| 🟠 Distribution | 5252 | Double rejection node | 23.6% | Weak hands trapped |
| 🟡 Pivot War Zone | 5050 | Decision cluster | 38.2% | Algo battle zone |
| ⚪ Current Price | ~4585 | PR equilibrium zone | Mid-range | Compression before FOMC |
| 🟢 Demand Zone | 4585-4545/4488 | PR BUYING ZONE | 61.8% | Institutional accumulation |
| 🔵 Deep Value | 4343 – 4040 | Panic liquidity sweep | 78.6%–100% | Extreme oversold |
⚙️ CORRELATION ENGINE (FOMC SENSITIVITY TABLE)
| Factor | Current Bias | Impact on Gold | Strength |
|---|---|---|---|
| 🇺🇸 DXY | Mild recovery | Bearish gold | 🔴 High |
| 📉 Real Yields (10Y) | Elevated | Bearish gold | 🔴 High |
| 🛢 Oil (War Premium) | Elevated | Bullish gold | 🟢 Medium |
| ⚔️ Geopolitics (US–Iran) | Uncertain | Bullish spikes | 🟢 High (event-driven) |
| 🏦 Fed Policy (TODAY) | Hawkish pause risk | Bearish initial move | 🔴 Very High |
| 💰 Liquidity Conditions | Tight | Volatility expansion | ⚪ Neutral |
📊 FOMC VOLATILITY MAP (STEP-BY-STEP MOVE PROJECTION)
🎯 Expected Move Range (FOMC Day)
- Base Case Volatility: $120 – $240
- Extreme Case: $240 – $360 spike range
🔻 SCENARIO MATRIX (PR PROBABILITY MODEL)
| Scenario | Trigger | Price Path | Probability |
|---|---|---|---|
| 🔴 Hawkish Fed (USD Spike) | No cuts / higher-for-longer tone | 4585 → 4488 → 4444 → 4385 | 45% |
| 🟡 Neutral / Mixed | Data-dependent tone | 4585 ↔ 4747 range sweep | 30% |
| 🟢 Dovish Surprise | Rate cut signals / soft tone | 4585 → 4669 → 4747 → 4848 | 25% |
🛡️ RISK MANAGEMENT (FOMC SURVIVAL RULES)
⚠️ Non-Negotiable Rules:
- ❌ No entries 5–10 min before FOMC
- ✅ Wait for first spike to complete
- ✅ Trade second move (confirmation candle)
- ❌ Avoid over-leverage (max 0.5–1% risk)
🧠 ECONOMIC LOGIC (CORE INSIGHT)
- Gold is currently not trending — it is positioning
- Market is pricing:
- ❌ No immediate cuts
- ⚠️ Sticky inflation
- Real yields = key driver → still bearish bias
- But:
- War premium = downside cushion
👉 Conclusion:
Short-term = bearish spikes
Medium-term = buy-the-dip structure intact