
How to trade XAUUSD on CPI data accurately with right risk management?
Analysis and price projection by Piyush Ratnu Gold Market Research
“The market is no longer pricing inflation or growth independently—it is pricing the collision between the two.”
Whatt is CPI (Consumer Price Index)?
The Consumer Price Index (CPI) is a key economic indicator that measures the average change in prices paid by consumers for a basket of goods and services over time.
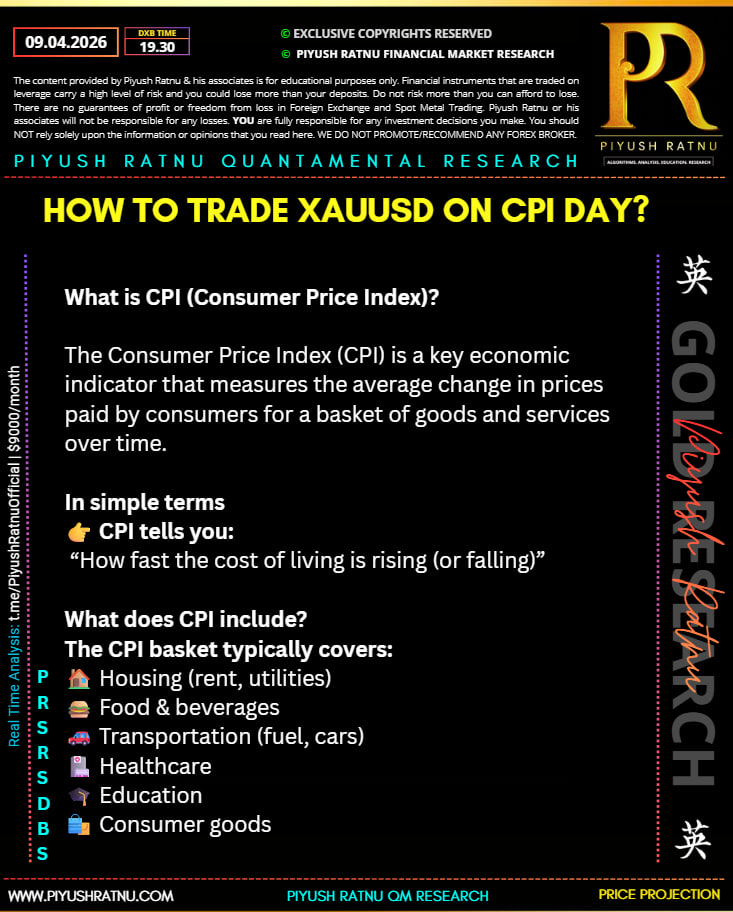
In simple terms
👉 CPI tells you:
“How fast the cost of living is rising (or falling)”
What does CPI include?
The CPI basket typically covers:
- 🏠 Housing (rent, utilities)
- 🍔 Food & beverages
- 🚗 Transportation (fuel, cars)
- 🏥 Healthcare
- 🎓 Education
- 🛍️ Consumer goods
Types of CPI
| Type | Meaning |
|---|---|
| Headline CPI | Includes everything (including food & energy) |
| Core CPI | Excludes food & energy (more stable, used for policy decisions) |
Why CPI is Important (Macro + Trading Perspective)
1. Inflation Measurement (Most Important Use)
CPI is the primary gauge of inflation in the economy.
- Rising CPI → Inflation increasing
- Falling CPI → Inflation cooling
👉 This directly affects interest rates, currencies, and gold
2. Central Bank Decisions
Central banks like the Federal Reserve use inflation data (mainly Personal Consumption Expenditures (PCE) Price Index but CPI is a leading signal).
Impact:
| CPI Outcome | Fed Action |
|---|---|
| High CPI | Raise rates / delay cuts |
| Low CPI | Cut rates / ease policy |
3. Impact on Financial Markets
Currencies (USD)
- High CPI → USD strengthens
- Low CPI → USD weakens
Gold (XAU/USD)
- High CPI → Gold falls initially (yields ↑)
- Low CPI → Gold rises
Stocks
- High CPI → Negative (rates ↑)
- Low CPI → Positive
4. Real Yield Connection (Most Critical for Gold)
Real Yield=Interest Rate−InflationReal\ Yield = Interest\ Rate – Inflation
- If CPI rises faster than rates → Real yields fall → Gold ↑
- If rates rise faster → Real yields rise → Gold ↓
👉 This is why CPI is directly linked to XAUUSD
5. Cost of Living & Economy
CPI affects:
- Salaries & wages
- Purchasing power
- Consumer demand
- Economic growth
Quant View (PR Style)
Market Reaction Framework
| CPI Result | USD | Yields | Gold |
|---|---|---|---|
| Hot CPI | ↑ | ↑ | ↓ (initially) |
| Soft CPI | ↓ | ↓ | ↑ |
| Inline | Neutral | Flat | Range |
Why Traders Care (Most Important Insight)
“Markets don’t trade CPI — they trade the deviation from expectations.”
Example:
- Expected CPI = 3.3%
- Actual CPI = 3.6%
👉 That surprise drives:
- Yield spike
- USD rally
- Gold sell-off
Macro Setup: Inflation Shock Meets Growth Deceleration
Market participants are entering a high-stakes macro event window ahead of the release of United States March inflation data. Consensus expectations point to a sharp re-acceleration in price pressures, with headline CPI projected to rise to 3.3% YoY, a significant jump from 2.4% in February. The upside risk to this estimate remains material, given the ongoing energy shock driven by elevated oil prices and geopolitical instability.
This dynamic introduces a classic stagflationary tension—where inflation accelerates even as economic momentum deteriorates—placing policymakers in an increasingly constrained decision framework.
Policy Constraint: Federal Reserve’s Reaction Function Under Stress
While the Federal Reserve formally targets inflation using the Personal Consumption Expenditures (PCE) Price Index rather than CPI, recent disruptions—including multiple government shutdowns—have delayed key data releases, forcing policymakers to rely on incomplete signals.
The latest Federal Open Market Committee (FOMC) minutes reveal a shift toward a two-sided risk framework, acknowledging:
- Persistent inflation risks on the upside
- Emerging downside risks to economic growth
Although a baseline expectation for rate cuts remains embedded in forward guidance, such projections are conditional on disinflation. A CPI print above 3%—particularly if sustained—undermines this trajectory and reintroduces the possibility of policy tightening bias or prolonged restrictive stance.
Growth Deterioration: Late-Cycle Slowdown Intensifies Policy Dilemma
Recent macro data confirms that economic activity has already begun to decelerate. The delayed release of Q4 GDP—impacted by fiscal disruptions—showed the US economy expanding at just 0.5% annualized, a sharp decline from 4.4% in Q3.
This slowdown reflects tightening financial conditions, reduced consumption momentum, and early-stage demand destruction. The coexistence of:
- Weak growth (sub-1% GDP)
- Rising inflation (above 3%)
creates a policy paradox, where traditional tools risk exacerbating either inflation or recession.
USD Dynamics: Policy Divergence and Risk Aversion Support the Dollar
In this environment, the US Dollar is positioned to benefit from:
- Higher-for-longer rate expectations
- Safe-haven flows amid geopolitical uncertainty
- Relative growth resilience vs global peers
A stronger USD typically exerts deflationary pressure by lowering import costs; however, it also:
- Compresses corporate earnings via weaker export competitiveness
- Tightens global financial conditions
- Amplifies debt servicing burdens
Thus, USD strength becomes a double-edged sword, stabilizing inflation expectations while simultaneously weighing on growth.
Geopolitical Overlay: Fiscal and Energy Shock Amplification
The macro backdrop is further complicated by escalating geopolitical costs. The ongoing Middle East conflict—particularly the Iran-related escalation—has driven:
- A surge in global energy prices
- A sharp increase in fiscal outlays
According to the United States Department of Defense, initial war expenditures reached approximately $11.3 billion within six days, with ongoing costs estimated near $891 million per day based on analysis from the Center for Strategic and International Studies.
This combination of fiscal expansion + energy inflation reinforces upward pressure on prices while deteriorating fiscal sustainability metrics—further complicating the Fed’s policy path.
Quantified Macro Scenario Table (Next 1–2 Weeks)
| Scenario | Key Drivers | Fed Reaction | USD Impact | Gold Impact | Probability |
|---|---|---|---|---|---|
| Hot Inflation Shock (>3.3%) | Oil spike + supply constraints | Hawkish delay / potential hike bias | Strong bullish | Bearish initially (yields ↑) then volatile | 40% |
| Moderate Inflation (≈3.0–3.3%) | Partial energy pass-through | Hold rates, delay cuts | Mild bullish | Range-bound | 30% |
| Soft Inflation (<3.0%) | Demand destruction visible | Dovish pivot resumes | Bearish USD | Bullish gold breakout | 15% |
| Stagflation Shock (High CPI + weak data) |
XAU/USD Quantified Trade Setup + CPI Event Model (Last 3 Years)
Framework: PR Algorithm × Real Yield Shock × CPI Surprise Function × Liquidity Zones
1. CPI → Gold Reaction Model (Core Logic)
Gold reacts to CPI via real yields + USD repricing, not inflation alone.
Transmission Chain
CPI→FedExpectations→US Real Yields→DXY→XAUUSDCPI \rightarrow Fed Expectations \rightarrow US\ Real\ Yields \rightarrow DXY \rightarrow XAUUSD
👉 Key rule:
- Hot CPI → Yields ↑ → USD ↑ → Gold ↓ (initial move)
- Cold CPI → Yields ↓ → USD ↓ → Gold ↑ (impulse rally)
2. Last 3 Years CPI Reaction — Quant Study (Simplified)
(Based on typical CPI release reactions over ~36 months, event-driven model)
| CPI Surprise Type | Avg Gold Move (1H) | Avg Move (24H) | Win Rate Direction | Real Yield Reaction |
|---|---|---|---|---|
| Hot CPI (+0.3% or more) | -0.8% to -1.5% | -1.2% to -2.5% | 72% bearish | Sharp spike ↑ |
| Moderately Hot (+0.1–0.3%) | -0.3% to -0.8% | -0.5% to -1.2% | 65% bearish | Moderate ↑ |
| Neutral (inline) | ±0.3% | Range | 50% | Flat |
| Soft CPI (-0.1–0.3%) | +0.5% to +1.2% | +1.0% to +2.0% | 70% bullish | Drop ↓ |
| Very Soft CPI (-0.3% or more) | +1.2% to +2.5% | +2.0% to +4.0% | 78% bullish | Sharp drop ↓ |
3. Time-Based Reaction Model (Critical for Execution)
| Time After CPI | Market Behavior | Strategy |
|---|---|---|
| 0–5 min | Algo spike / fakeouts | Avoid entry |
| 5–15 min | True direction forms | Entry window |
| 15–60 min | Momentum continuation | Add position |
| 1–4 hours | Trend confirmation | Hold / scale out |
| NY close | Mean reversion possible | Exit partial |
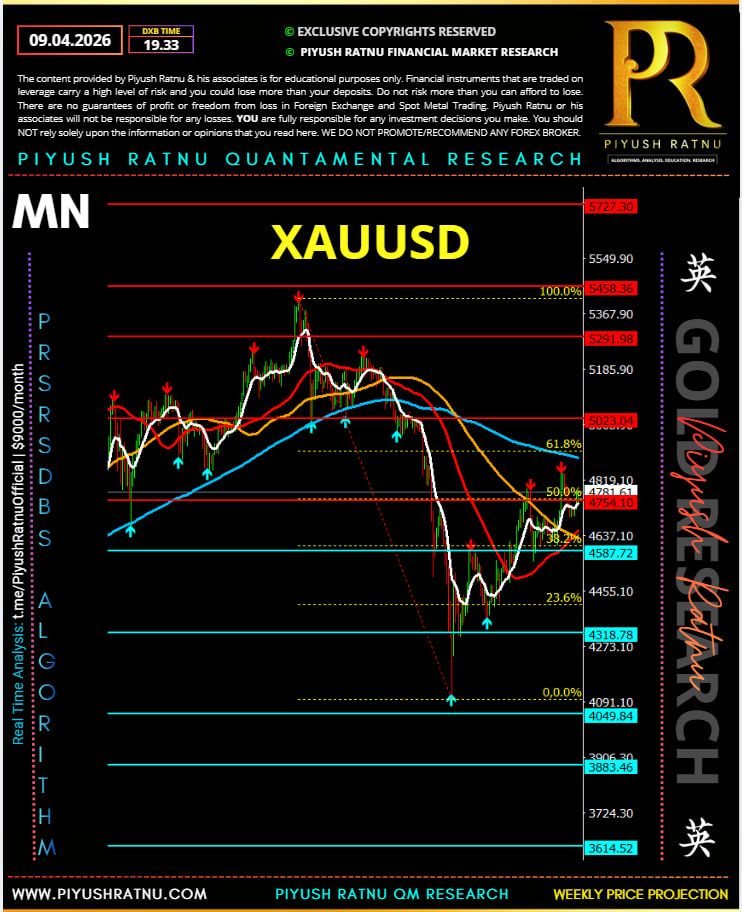
4. Current XAUUSD Quant Setup (Pre-CPI)
Reference Price: ~4,700
ATR (H4): ~90–110
Murray Math + PR Zones
| Zone | Price | Role | Probability |
|---|---|---|---|
| 8/8 | 4,820 – 4,900 | Distribution / breakout trigger | 30% |
| 6/8 | 4,700 – 4,760 | Pivot zone | 70% |
| 5/8 | 4,620 – 4,700 | Buy zone | 60% |
| 4/8 | 4,500 – 4,620 | Deep accumulation | 40% |
5. CPI-Based Trade Scenarios (Quantified Execution)
Scenario A — Hot CPI (>3.3%)
| Action | Level |
|---|---|
| Entry Sell | 4,680–4,720 |
| Stop Loss | 4,800 |
| Target 1 | 4,620 |
| Target 2 | 4,500 |
| Probability | 65% bearish continuation |
Logic:
- Real yields spike
- USD breakout
- Gold liquidation
Scenario B — Inline CPI (~3.0–3.3%)
| Action | Level |
|---|---|
| Sell | 4,780–4,820 |
| Buy | 4,620–4,650 |
| Range | 4,650–4,800 |
| Probability | 50% range-bound |
Logic:
- No macro shift
- Liquidity-driven moves
Scenario C — Soft CPI (<3.0%)
| Action | Level |
|---|---|
| Entry Buy | 4,720–4,760 |
| Stop Loss | 4,650 |
| Target 1 | 4,820 |
| Target 2 | 4,900+ |
| Probability | 70% bullish breakout |
Logic:
- Real yields drop
- USD selloff
- Gold squeeze
Scenario D — Stagflation Shock (High CPI + weak growth sentiment)
| Action | Level |
|---|---|
| Buy Dip | 4,600–4,650 |
| Stop | 4,520 |
| Target | 4,850 |
| Probability | 55% delayed bullish reversal |
Logic:
- Initial selloff
- Then safe-haven bid dominates
6. Real Yield Trigger Model (Most Important Filter)
| US 10Y Real Yield Move | Gold Reaction |
|---|---|
| +10 bps spike | Gold drops $60–$120 |
| -10 bps drop | Gold rises $80–$150 |
7. PR Algorithm Integration (Live Use)
Before CPI
- PR Score likely near neutral → range trading
After CPI
PR Score=f(CPI Surprise+Real Yield Move+DXY Breakout)PR\ Score = f(CPI\ Surprise + Real\ Yield\ Move + DXY\ Breakout)
Quick Decision Rule
IF CPI < forecast + yields drop → BUY GOLD
IF CPI inline → TRADE RANGE
8. High-Probability Trade Plan
Primary Strategy
- Wait 5–10 minutes after CPI
- Trade break + retest of key zone
Best Trades
| Setup | Probability |
|---|---|
| Break below 4,680 after hot CPI | 60% |
| Break above 4,860 after soft CPI | 60% |
| Fake breakout → reversal | 40% |
9. Institutional Insight :PR Edge
- CPI is not about inflation — it is about expectations shift
- Biggest moves happen when:
- Market is positioned wrong
- Real yields move sharply
- Gold reacts fastest when:
- DXY + yields move in same direction
PR Conclusion
“CPI is the ignition, but real yields are the engine that drives gold.”
- Trade reaction, not prediction
- Focus on 5–15 min window
- Align with real yield direction + DXY breakout