How to trade XAUUSD Spot Gold accurately and safely on US CPI Data Day?
XAU/USD Market Outlook | CPI & Fed in Focus as Gold Stabilizes Above $4,000
PR Quant Macro Analysis
1. Market Overview – Gold Attempts a Technical Recovery
Gold (XAU/USD) is attempting a modest rebound during Tuesday’s Asian session after falling to a two-week low near $3,985. The recovery above the $4,000 psychological level has been supported primarily by a temporary pause in the US Dollar’s rally and short-covering ahead of two major macroeconomic events:
- US Consumer Price Index (CPI)
- Federal Reserve Chair Kevin Warsh’s testimony before the House Financial Services Committee
Despite the recovery, market participants remain cautious, preferring to reduce directional exposure until both inflation data and the Fed’s policy guidance provide greater clarity.
2. Why Gold Fell
Monday’s sharp decline was driven by renewed geopolitical escalation between the United States and Iran, particularly around military operations in the Strait of Hormuz.
Key developments included:
- New US military strikes on multiple Iranian strategic locations.
- Iranian retaliation targeting oil infrastructure and maritime assets.
- Increased risks to global energy transportation.
- Strong demand for the US Dollar as a safe-haven currency.
The stronger Dollar increased pressure on Gold despite elevated geopolitical uncertainty.
3. Why Gold Is Recovering Today
Tuesday’s rebound is largely technical rather than fundamentally bullish.
Supporting factors include:
✔ Profit-taking in the US Dollar after reaching two-week highs.
✔ Position adjustment ahead of high-impact economic events.
✔ Dip-buying near the important $4,000 support zone.
✔ Additional geopolitical uncertainty after the European Union imposed new sanctions targeting Sudan’s gold trade.
These factors have helped stabilize Gold, although conviction remains limited.
4. Middle East Escalation Remains the Dominant Macro Risk
The geopolitical backdrop continues to deteriorate.
Latest developments include:
- US CENTCOM confirmed fresh strikes against Iranian military facilities across several strategic locations.
- Iranian forces responded with attacks on commercial shipping.
- Reports indicate two UAE-linked tankers operating near the Strait of Hormuz were struck.
- Iran warned that continued military cooperation with the United States could significantly delay reopening of the Strait, increasing the risk of a prolonged disruption to global energy supplies.
The market continues to monitor whether the conflict evolves into a broader regional energy crisis.
5. Oil Prices Become the Critical Variable
Unlike previous geopolitical episodes where Gold benefited significantly from safe-haven demand, this situation is creating a different macro dynamic.
Higher Oil prices increase:
- Global inflation expectations
- Producer costs
- Transportation costs
- Long-term inflation risks
As inflation expectations rise, markets begin pricing the possibility that the Federal Reserve may maintain restrictive monetary policy for longer or even consider additional tightening.
This mechanism tends to support the US Dollar while limiting Gold’s upside.
6. Today’s Key Market Catalysts
US CPI Inflation Report
Markets will closely monitor:
- Headline CPI
- Core CPI
- Shelter inflation
- Services inflation
- Monthly inflation momentum
A stronger-than-expected CPI would reinforce expectations of a more hawkish Federal Reserve.
Federal Reserve Chair Kevin Warsh Testimony
Investors will focus on:
- Inflation outlook
- Interest-rate guidance
- Labour market assessment
- Balance-sheet policy
- Risks from rising energy prices
- Future policy bias
Any hawkish tone would likely strengthen the US Dollar and weigh further on Gold.
7. PR Correlation Matrix
| Market Variable | Bullish for Gold | Bearish for Gold | Current Bias |
|---|---|---|---|
| US Dollar Index (DXY) | ▼ Weak USD | ▲ Strong USD | Slightly Bearish |
| US 10-Year Yield | ▼ Falling | ▲ Rising | Bearish |
| Oil Prices | Mild Bullish initially | Strong Bearish if inflation dominates | Bearish |
| CPI Inflation | Lower than expected | Higher than expected | Event Risk |
| Fed Expectations | Dovish | Hawkish | Hawkish Risk |
| Geopolitical Risk | Safe-haven demand | Inflation-led tightening | Mixed |
| Risk Sentiment | Risk-off | Risk-on | Neutral |
| Central Bank Demand | Positive | Negative | Neutral Positive |
8. PR Probability Matrix
| Scenario | Probability | Expected Gold Reaction |
|---|---|---|
| Soft CPI + Dovish Warsh | 20% | Strong Bullish |
| Soft CPI + Hawkish Warsh | 15% | Mild Bullish then Neutral |
| CPI In-line + Neutral Warsh | 30% | Range Trading |
| Hot CPI + Neutral Warsh | 20% | Bearish |
| Hot CPI + Hawkish Warsh | 15% | Strong Bearish |
9. PR Institutional Correlation Score
| Factor | Weight | Current Impact |
|---|---|---|
| Inflation | 25% | Bearish |
| Federal Reserve | 20% | Bearish |
| US Dollar | 15% | Bearish |
| Bond Yields | 10% | Bearish |
| Oil Prices | 10% | Bearish |
| Geopolitical Risk | 10% | Bullish |
| Safe Haven Demand | 5% | Bullish |
| Central Bank Buying | 5% | Bullish |
Net Quant Bias: Moderately Bearish
10. PR Trading Bias
Bullish Drivers
- Profit-taking in the US Dollar
- Technical recovery from oversold conditions
- Geopolitical uncertainty supporting safe-haven demand
- Physical demand near major support levels
Bearish Drivers
- Rising Oil prices increasing inflation risks
- Expectations of prolonged restrictive Fed policy
- Strong US Dollar trend
- Higher Treasury yields
- Potential hawkish testimony from Fed Chair Kevin Warsh
11. PR Quant Conclusion
Gold has stabilized above the $4,000 psychological level after Monday’s sharp decline, but the recovery currently appears corrective rather than the start of a sustained bullish trend.
The market is transitioning from a geopolitical-driven environment to a macroeconomic-driven environment, where inflation data and Federal Reserve guidance are likely to determine the next major directional move.
In the near term, US CPI and Chair Warsh’s testimony remain the highest-impact catalysts. A hotter-than-expected inflation print combined with a hawkish policy tone would likely strengthen the US Dollar and Treasury yields, increasing downside pressure on Gold. Conversely, softer inflation or a more balanced policy message could trigger short covering and support a stronger recovery.
PR Quant Market Bias
- Short-term (24–48 hours): Neutral to Moderately Bearish
- Volatility Outlook: High
- Primary Drivers: US CPI, Fed guidance, DXY, US yields, Oil prices, and Middle East developments.
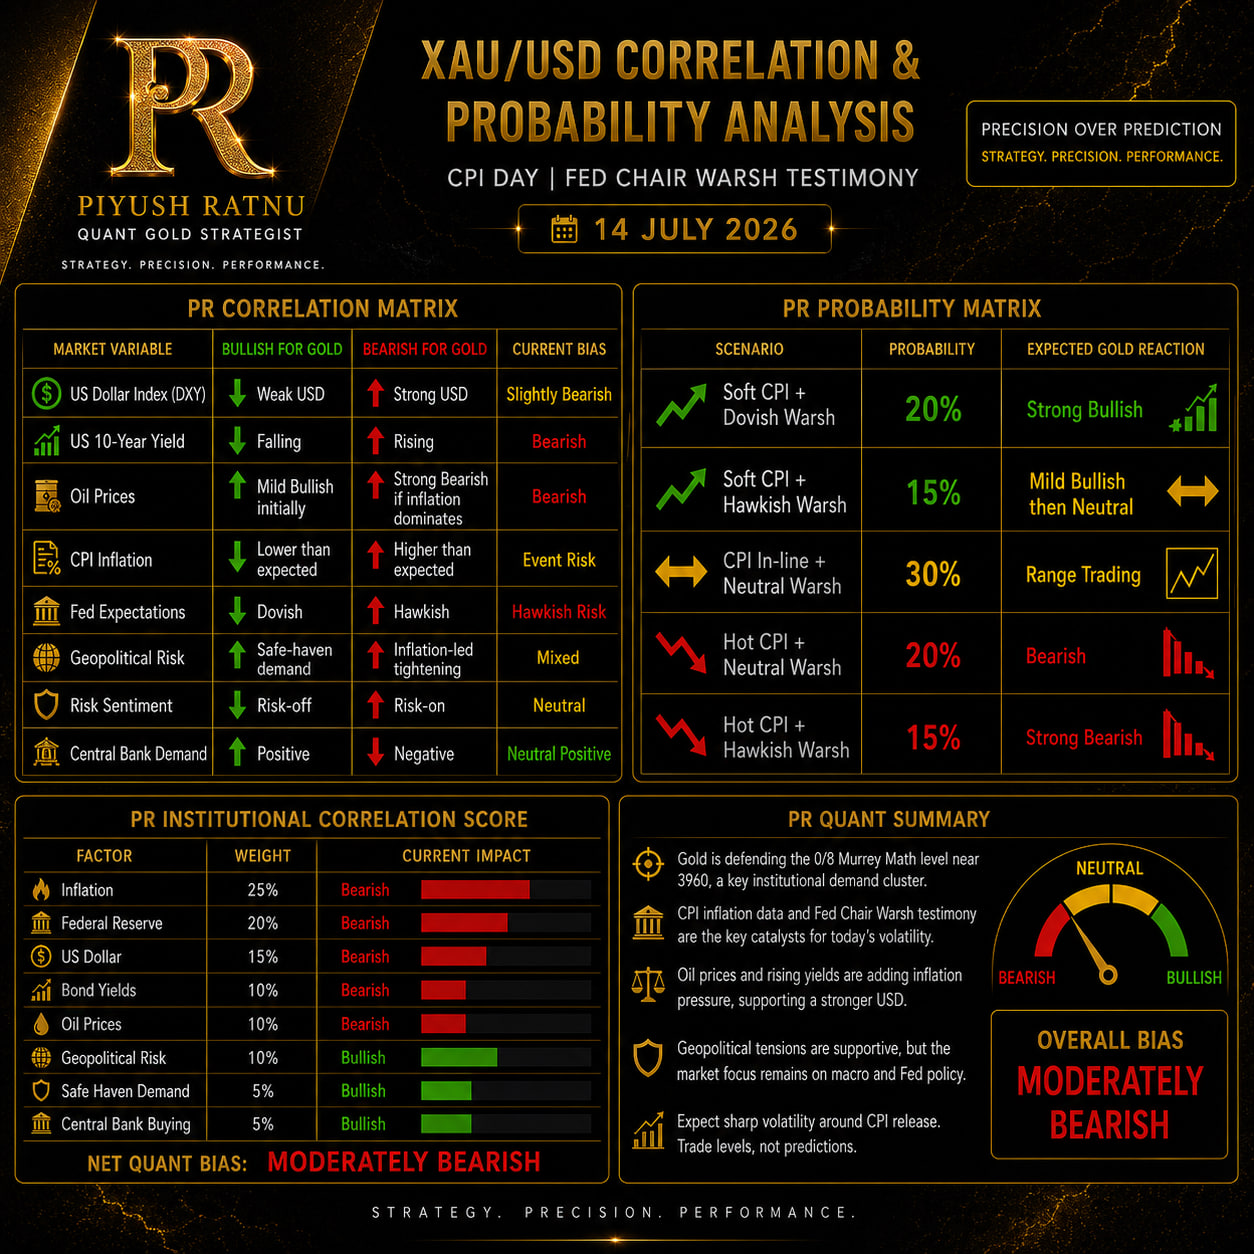
XAU/USD CPI Day Probability Analysis
PR Quant Cluster Theory + Murrey Math Framework
Timeframe: Intraday (chart provided)
Event: US CPI + Fed Chair Kevin Warsh Testimony
Note: This analysis is based only on the uploaded chart and technical interpretation. CPI is a high-impact event, so volatility can invalidate technical levels quickly.
PR Cluster Structure
From the chart, the market has completed a sharp impulsive decline from approximately 4141 to the 3969 cluster before showing an initial reaction.
Primary Resistance Clusters
| Zone | PR Cluster Strength | Remarks |
|---|---|---|
| 4024–4040 | ★★★★☆ | Immediate supply / first recovery barrier |
| 4085–4104 | ★★★★★ | Major PR Cluster + Murrey confluence |
| 4141–4169 | ★★★★★ | Structural trend reversal zone |
| 4224-4242 | ★★★★★ | Extreme bullish confirmation |
Primary Support Clusters
| Zone | PR Cluster Strength | Remarks |
|---|---|---|
| 3969–3989 | ★★★★★ | Current institutional demand cluster |
| 3900–3939 | ★★★★☆ | Second accumulation zone |
| 3838–3869 | ★★★★★ | Long-term liquidity pool |
Murrey Math Analysis
Current price is sitting almost exactly around the 0/8 Murrey reversal area.
This level historically behaves as:
- exhaustion level
- panic selling zone
- institutional accumulation zone
provided macro news does not completely invalidate it.
Murrey Levels
| Murrey Level | Interpretation |
|---|---|
| 0/8 | Strong support |
| 2/8 | Initial recovery objective |
| 4/8 | Equilibrium zone |
| 6/8 | Strong resistance |
| 8/8 | Trend completion |
Current structure suggests Gold is attempting to defend the 0/8 zone.
PR Cluster Theory Interpretation
Your PR Cluster Theory focuses on areas where multiple technical variables converge rather than single horizontal levels.
Current cluster observations:
Cluster 1
3969-3989
Confluence:
- Murrey 0/8
- Psychological 4000 rejection area
- Liquidity sweep
- Previous swing low
- Oversold momentum
Probability:
Institutional buying interest increases.
Cluster 2
4024-4040
Contains:
- Previous breakdown point
- EMA cluster
- Fibonacci reaction
- Short-term supply
This is the first area where sellers are expected to reappear.
Cluster 3
4085-4140
Largest institutional resistance cluster.
Contains:
- Murrey equilibrium
- Fib retracement
- Previous consolidation
- Dynamic moving averages
If price reaches here after CPI, trend direction will become much clearer.
Market Structure
Current trend:
✅ Lower highs
✅ Lower lows
Trend therefore remains:
Bearish
Current bounce is still only a counter-trend move until 4085–4141 is reclaimed.
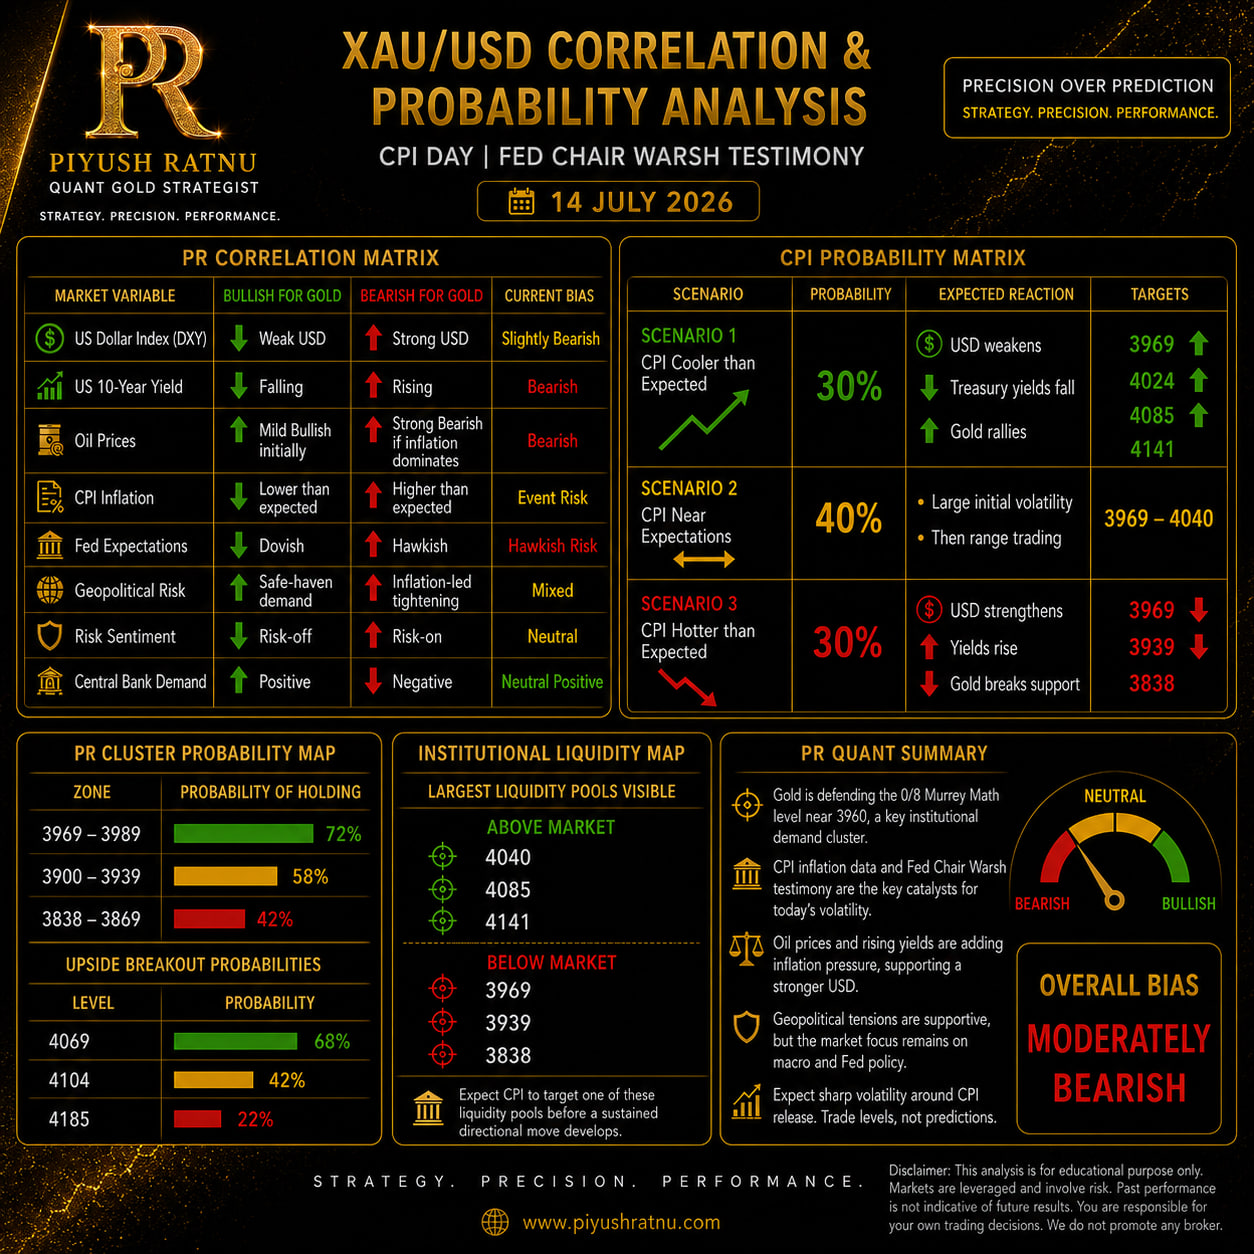 CPI Probability Matrix
Scenario 1
CPI Cooler than Expected
Probability:
30%
Expected reaction:
- USD weakens
- Treasury yields fall
- Gold rallies
Targets
3969
⬆
4024
⬆
4085
⬆
4141
Scenario 2
CPI Near Expectations
Probability:
40%
Likely outcome
Large initial volatility
Then
Range trading
Expected range
3969–4040
Scenario 3
CPI Hotter than Expected
Probability:
30%
Expected reaction
USD strengthens
Yields rise
Gold breaks support
Targets
3969
↓
3939
↓
3838
PR Quant Correlation Matrix
| Variable | Current Reading | Gold Impact |
|---|---|---|
| US Dollar | Slightly Strong | Bearish |
| Oil | Rising | Inflationary (Bearish for Gold if Fed stays hawkish) |
| US 10Y Yield | Elevated | Bearish |
| CPI Risk | High | High Volatility |
| Geopolitics | Positive for Gold | Bullish |
| Fed Expectations | Hawkish bias | Bearish |
Overall correlation score:
Slightly Bearish
Institutional Liquidity Map
Largest liquidity pools visible
Above market
- 4040
- 4085
- 4141
Below market
- 3969
- 3939
- 3838
Expect CPI to target one of these liquidity pools before a sustained directional move develops.
PR Cluster Probability Map
| Zone | Probability of Holding |
|---|---|
| 3969–3989 | 72% |
| 3900–3939 | 58% |
| 3838–3869 | 42% |
Upside breakout probabilities:
| Level | Probability |
|---|---|
| 4069 | 68% |
| 4104 | 42% |
| 4185 | 22% |
PR Trading Bias
Bullish Trigger
- CPI below consensus.
- DXY weakens and US 10-year yields decline.
- Price closes above 4024, opening the path toward 4085–4141.
Bearish Trigger
- CPI above consensus or hawkish Fed commentary.
- Price loses 3969 on strong volume.
- Next downside clusters become 3939 followed by 3838.
PR Quant Conclusion
Gold is testing a high-confluence demand cluster around 3939–3969, where Murrey Math’s 0/8 support, prior liquidity, and PR Cluster Theory align. This makes the area technically significant, but today’s CPI release is likely to dominate price action.
The technical backdrop remains bearish because the sequence of lower highs and lower lows has not yet been broken. A bounce from current levels would still be considered corrective unless price can reclaim the 4085–4141 resistance cluster. Conversely, a decisive break below 3969 would increase the probability of a move toward 3939 and potentially 3838.
PR Quant Bias (pre-CPI):
- Bullish: 35%
- Neutral / Range: 30%
- Bearish: 35%
Given the event risk, the first move immediately after CPI may not be the final move. Waiting for confirmation after the initial volatility often reduces the risk of trading a false breakout or liquidity sweep.