How to trade XAUUSD Spot Gold accurately in June July August 2026? READ RISK DISCLOSURE Carefully.
Piyush Ratnu Quant Strategy – XAUUSD 3-Month Projection Matrix (June–August 2026)
| Month | Trend Bias | Probability | Primary Support Zone | Accumulation Zone | Target Zone 1 | Target Zone 2 | Extreme Target |
|---|---|---|---|---|---|---|---|
| June 2026 | Neutral-Bullish | 65% | 4343–4444 | 4444–4545 | 4646 | 4848 | 5050 |
| July 2026 | Bullish | 70% | 4444–4545 | 4545–4646 | 4848 | 5050 | 5555 |
| August 2026 | Strong Bullish | 75% | 4545–4646 | 4646–4848 | 5050 | 5252 | 5555 |
Institutional Liquidity Cluster Model
| Cluster | Importance | Interpretation |
|---|---|---|
| 4242/4040 | Extreme Support | Black Swan Liquidity Zone |
| 4343 | Major Support | Institutional Demand Zone |
| 4444 | Primary Buying Zone | Quant Accumulation Area |
| 4545 | Strategic Buying Zone | Smart Money Re-entry |
| 4646 | Fair Value Zone | Trend Confirmation |
| 4848/4949 | Expansion Target | Momentum Objective |
| 5050/5151 | Macro Breakout Zone | Bull Market Extension |
| 5555/5656 | Super-Cycle Target | Extreme Bullish Scenario |
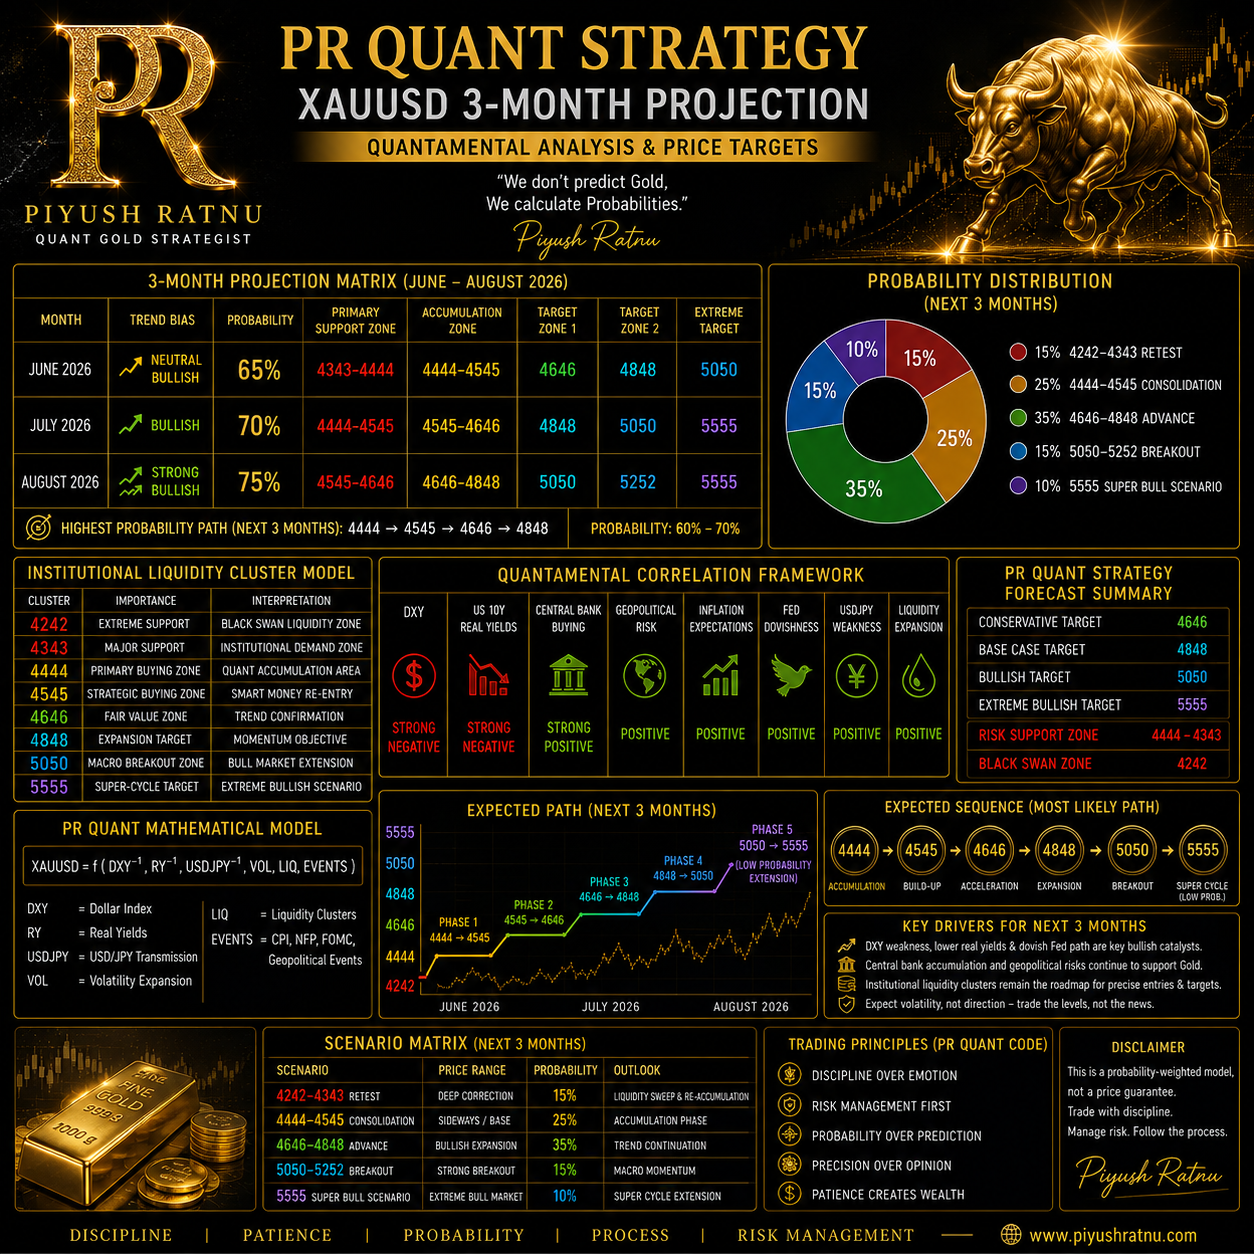 Probability Distribution (Next 3 Months)
| Scenario | Probability |
|---|---|
| 4242–4343 Retest | 15% |
| 4444–4545 Consolidation | 25% |
| 4646–4848 Advance | 35% |
| 5050–5252 Breakout | 15% |
| 5555 Super Bull Scenario | 10% |
Quantamental Correlation Framework
| Variable | Correlation with Gold |
|---|---|
| DXY | Strong Negative |
| US 10Y Real Yields | Strong Negative |
| Central Bank Buying | Strong Positive |
| Geopolitical Risk | Positive |
| Inflation Expectations | Positive |
| Fed Dovishness | Positive |
| USDJPY Weakness | Positive |
| Liquidity Expansion | Positive |
PR Quant Strategy Forecast Summary
| Projection Type | Target |
|---|---|
| Conservative Target | 4646 |
| Base Case Target | 4848 |
| Bullish Target | 5050 |
| Extreme Bullish Target | 5555 |
| Risk Support Zone | 4444–4343 |
| Black Swan Zone | 4242 |
Expected Path
| Sequence | Expected Zone |
|---|---|
| Phase 1 | 4444 → 4545 |
| Phase 2 | 4545 → 4646 |
| Phase 3 | 4646 → 4848 |
| Phase 4 | 4848 → 5050 |
| Phase 5 | 5050 → 5555 (Low Probability Extension) |
Highest-Probability Quant Path (PR Framework):
4444 → 4545 → 4646 → 4848 with approximately 60–70% probability, while 5050–5555 remains a higher-volatility macro expansion scenario dependent on DXY weakness, declining real yields, and supportive geopolitical conditions.