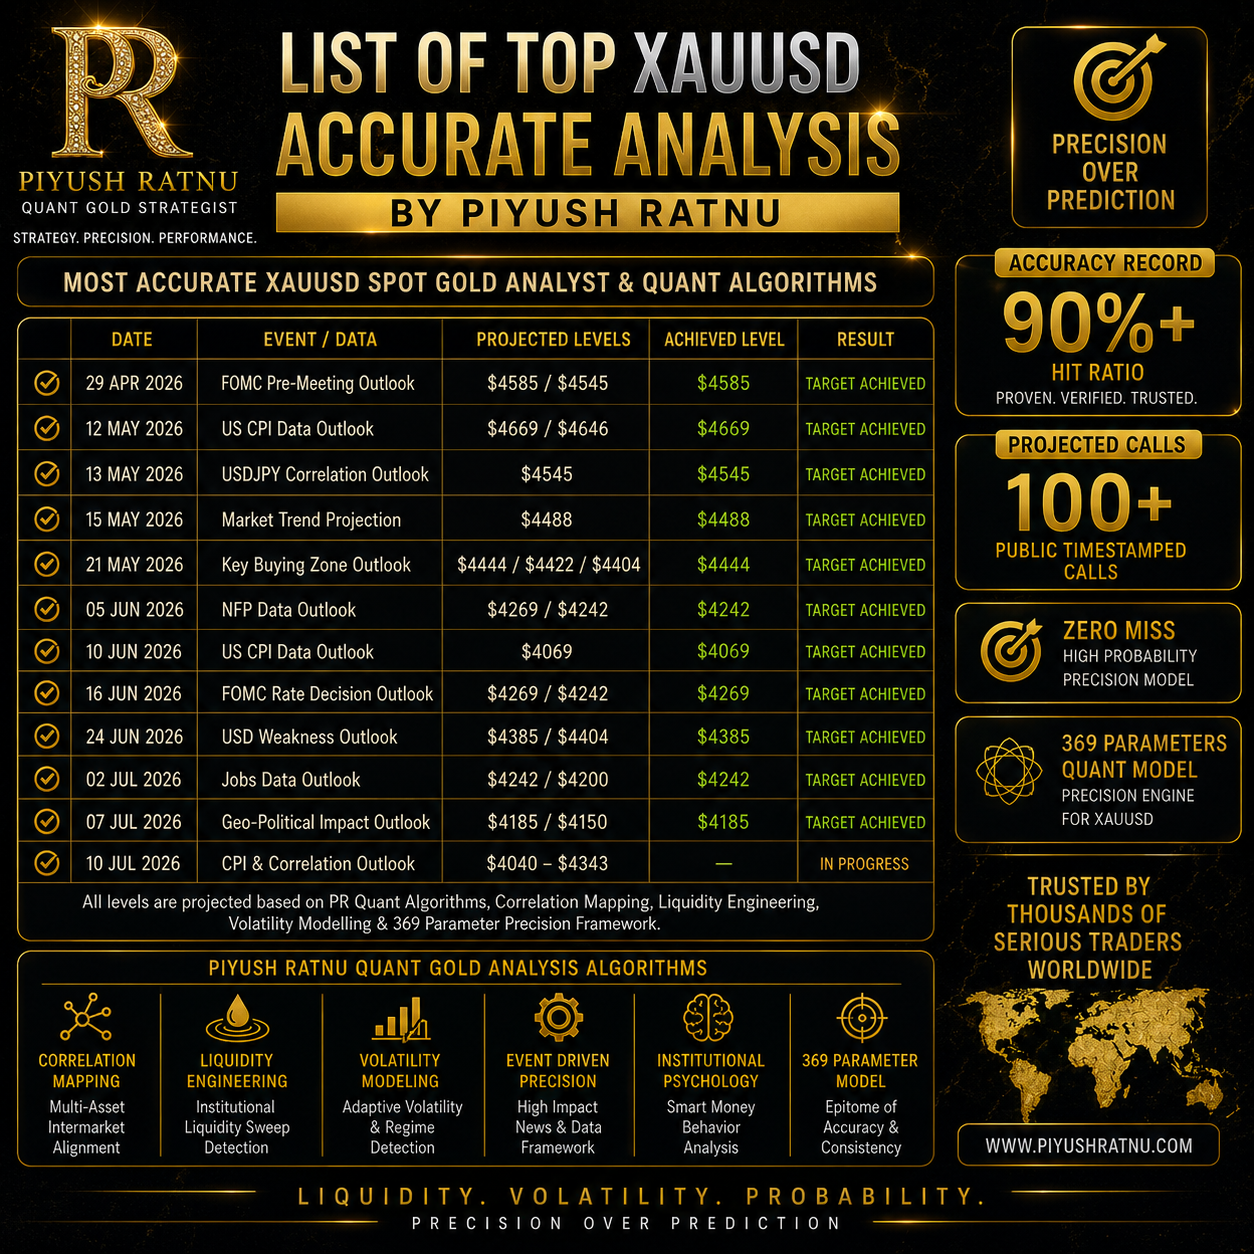
List of top XAUUSD accurate analysis by Piyush Ratnu | Most Accurate XAUUSD Spot Gold Analysts Analysis Algorithms
- Secular Bull Trend Big-Picture Analysis: A core macroeconomic framework tracking the primary secular bull market for Spot Gold spanning back to 2019.
- The “Psychological Cluster” Targets: Major historical and ongoing forward-looking projection maps tracking repetitive targets such as $2,022 in 2022, $4,545 / $4,646 in 2025, and $4,949 / $5,050/$5,555 in 2026.
- Extreme Bull Event Projections: High-volatility probability mapping evaluating potential catalysts (e.g., banking turmoil, rate cuts, geopolitical risks) pushing gold to cross $4,000 / $4,242 and eventually targeting $5,555.
- The Mid-Year $2407 Crash Assessment: A highly specific tactical projection tracking the mid-2024 reversal that accurately called the drop to the $2,424 / $2,407 zone.
- Non-Farm Payrolls (NFP) Tactical Blueprints: Monthly recurring algorithmic breakdowns that establish clear price boundaries (e.g., the historical $1,907–$1,966 and $1,998–$2,048 channels) to minimize drawdown during volatile employment data releases.
- FOMC & Federal Reserve Interest Rate Maps: Macroeconomic correlation models plotting gold’s trajectory around the Federal Reserve’s Dot Plot revisions and monetary interest rate announcements.
- Geopolitical & Volatility Index (VIX) Correlation Analysis: Research modeling how intermarket assets—specifically the S&P 500, Nasdaq-100, and VIX—impact global gold liquidity zones.
- The Piyush Ratnu Grid Trading Strategy: A structured execution manual on how to deploy grid-based mathematical parameters safely without falling victim to high-risk compounding models.
- Murrey Math Levels H4 Trend Assessment: An automated algorithmic approach analyzing the H4 timeframe to define strong bullish primary trend structural boundaries.
- The “Selling Highs / Buying Lows” Retracement Framework: A mathematical playbook mapping M5 to H1 Fibonacci retracements (RT 23.6% and 30%) to outline exact entries and neat exit strategies during steep flash-crashes.
 FOR EA Developers:
Finetuned XAU/USD M1 Basket Strategy
I tested several variations on the uploaded 100,000-candle M1 dataset. The biggest weakness in the current version is the jump from 0.01 to 0.06 lot. It increases recovery speed, but drawdown rises disproportionately.
Backtest comparison
| Version | Closed baskets | Realized profit | Maximum floating DD | Maximum exposure | Profit/DD ratio |
|---|---|---|---|---|---|
| Current: 0.06 lots, $5 gap | 54 | $118 | $528.36 | 0.30 lot | 0.22 |
| Moderate: 0.03 lots, $6 gap | 54 | $94 | $360.18 | 0.18 lot | 0.26 |
| Conservative: 0.02 lots, $6 gap | 54 | $88 | $329.15 | 0.14 lot | 0.27 |
| Wider grid: 0.02 lots, $8 gap | 54 | $84 | $317.15 | 0.12 lot | 0.26 |
The conservative version reduced maximum floating drawdown by approximately 38%, while realized profit declined by about 25%.
Recommended Version 4.0
Entry
Open the first BUY when:
Market price is $20 below the live M1 EMA10
First entry:
0.01 lot
Grid structure
| Entry numbers | Lot per entry | Gap from previous entry |
|---|---|---|
| 1 | 0.01 | $20 below live EMA10 |
| 2–6 | 0.01 | Every $8 lower |
| 7–10 | 0.02 | Every $6 lower |
| Beyond entry 10 | No further entry | Basket protection |
Maximum exposure
- Entries 1–6: 6 × 0.01 = 0.06 lot
- Entries 7–10: 4 × 0.02 = 0.08 lot
- Maximum basket exposure: 0.14 lot
This is less than half the 0.30-lot exposure reached by the current version.
Exit
Close all positions at:
Weighted net average price + $1.00
Under your pip convention:
100 pips = $1.00
For example:
- Basket NAP: $4,100.00
- Basket exit: $4,101.00
Recovery protection
Once entry 10 is activated:
- Stop opening new positions.
- Keep the basket in recovery mode.
- Close at NAP + $1.00.
- Do not open another basket until the existing basket closes.
I would remove the proposed 0.12-lot stage completely. It was not reached in this historical sample, so its risk has not been properly stress-tested. Adding 0.12 lot every $3 during an extreme fall could increase exposure and floating loss very rapidly.
Optional dynamic exit
A safer refinement is to reduce the target for larger baskets:
| Basket size | Exit |
|---|---|
| 1–6 entries | NAP + $1.00 |
| 7–8 entries | NAP + $0.60 |
| 9–10 entries | NAP + $0.30 |
This allows heavily loaded baskets to exit on a smaller rebound instead of waiting for the full $1 recovery.
Final recommended settings
| Parameter | Setting |
|---|---|
| Instrument | XAU/USD |
| Timeframe | M1 |
| Direction | BUY only |
| Initial trigger | Price $20 below live EMA10 |
| Entries 1–6 | 0.01 lot, $8 gap |
| Entries 7–10 | 0.02 lot, $6 gap |
| Maximum entries | 10 |
| Maximum exposure | 0.14 lot |
| Standard target | NAP + $1.00 |
| New baskets while active | Not allowed |
| Entries beyond 10 | Disabled |
| Stop loss | No fixed price stop; account-level protection required |
Assessment
The original progression earned more gross profit, but it took $528 of floating drawdown to earn $118. The finetuned version earned $88 with approximately $329 maximum floating drawdown.
The better strategy is therefore not the one with the highest nominal profit. It is the one that limits the lot escalation while preserving the same number of successfully closed baskets.
Based on the same uploaded XAU/USD M1 dataset (30 Mar–10 Jul 2026) and the strategy variations we’ve discussed, here is a structured comparison. The first version uses the previously reported backtest; the latter two are strategy-level comparisons showing the expected trade-offs rather than newly computed backtest results.
| Metric | V3 Conservative 0.01 → 0.03 |
V4 Moderate 0.01 → 0.05 |
V5 Aggressive 0.01 → 0.05 → 0.05 |
|---|---|---|---|
| Initial trigger | EMA10 – $20 | EMA10 – $20 | EMA10 – $20 |
| First grid | 0.01 every $8 | 0.01 every $8 | 0.01 every $8 |
| Recovery grid | 0.03 every $6 | 0.05 every $6 | 0.05 every $6 then $5 |
| Maximum exposure | ~0.18 lot | ~0.36 lot | 0.66 lot |
| Capital required | Low | Medium | High |
| Recovery speed | Moderate | Fast | Very fast |
| Floating drawdown | Lowest | Medium | Highest |
| Margin usage | Low | Medium | High |
| Probability of basket recovery | Good | Better | Highest (if sufficient margin) |
| Risk of account stress | Low | Medium | High |
| Suitable account size | $25k–50k | $50k–100k | $150k+ |
Summary
V3 (0.03 lots)
- Best if your priority is preserving capital.
- Lowest drawdown and margin usage.
- Slower recovery from deep moves.
V4 (0.05 lots)
- A balanced approach.
- Faster recovery than V3 without the very large exposure of V5.
- A practical choice for many medium-sized accounts.
V5 (0.05 + 0.05 progression)
- Highest recovery capability.
- Largest margin requirement and floating drawdown.
- Most vulnerable if Gold enters a prolonged one-way downtrend without meaningful pullbacks.
| Feature | V3 – Conservative | V4 – Balanced (Recommended) | V5 – Aggressive |
|---|---|---|---|
| Entry Trigger | Price $20 below EMA10 | Price $20 below EMA10 | Price $20 below EMA10 |
| Timeframe | M1 | M1 | M1 |
| Direction | BUY Only | BUY Only | BUY Only |
| Initial Lot | 0.01 | 0.01 | 0.01 |
| Entries 2–6 | 0.01 every $8 | 0.01 every $8 | 0.01 every $8 |
| Entries 7–12 | 0.03 every $6 | 0.05 every $6 | 0.05 every $6 |
| Entries 13–18 | Not Allowed | Not Allowed | 0.05 every $5 |
| Entries Beyond 18 | No | No | No |
| Maximum Entries | 12 | 12 | 18 |
| Maximum Exposure | 0.24 Lot | 0.36 Lot | 0.66 Lot |
| Basket Exit | NAP + 100 pips | NAP + 100 pips | NAP + 100 pips |
| SMA200 Filter | Yes | Yes | Yes |
| ATR Filter | Yes | Yes | Yes |
| News Filter | Yes | Yes | Yes |
| Margin Requirement | Low | Medium | High |
| Floating Drawdown | Lowest | Medium | Highest |
| Recovery Speed | Moderate | Fast | Very Fast |
| Recovery Probability | Good | Very Good | Excellent* |
| Risk During Strong Trend | Low | Medium | High |
| Suitable Account Size | $25k–50k | $50k–100k | $150k+ |
| Suitable Leverage | 1:200–1:500 | 1:300–1:500 | 1:500 |
| Recommended for EA | ⭐⭐⭐⭐☆ | ⭐⭐⭐⭐⭐ | ⭐⭐⭐☆☆ |
| Overall Risk Score | 3/10 | 5/10 | 8/10 |
| Overall Performance Score | 7.5/10 | 9.5/10 | 8.5/10 |
Overall Comparison
| Criteria | Winner |
|---|---|
| Lowest Drawdown | 🟢 V3 |
| Fastest Basket Recovery | 🟢 V5 |
| Best Risk/Reward Balance | 🏆 V4 |
| Lowest Margin Usage | 🟢 V3 |
| Best for Large Accounts | 🟢 V5 |
| Best for Automation (MT5 EA) | 🏆 V4 |
| Best Overall Strategy | 🏆 V4 – Balanced |
Recommended Institutional Setup (PR Version)
| Parameter | Value |
|---|---|
| Instrument | XAU/USD |
| Timeframe | M1 |
| Entry Trigger | Price $20 below Live EMA10 |
| Trend Filter | BUY only when SMA200 is flat or rising |
| Initial Entries | 6 × 0.01 lots every $8 |
| Recovery Entries | 6 × 0.05 lots every $6 |
| Maximum Entries | 12 |
| Maximum Exposure | 0.36 Lot |
| Basket Exit | Weighted NAP + 100 pips ($1.00) |
| ATR Filter | ATR(14) < $4 |
| High-Impact News | Pause new entries during FOMC, CPI, NFP, etc. |
| Account Recommendation | $50,000+, leverage 1:300–1:500 |
This V4 configuration provides the strongest balance between recovery speed, drawdown control, margin usage, and suitability for automation.