Year-Wise Backtest Report
Piyush Ratnu — XAUUSD Analysis Performance
 2021 — Foundation & Transition Phase
| Metric | Result |
|---|---|
| Total Calls | 8 |
| Full Hits | 6 |
| Partial Hits | 1 |
| Misses | 1 |
| Accuracy | 75.00% |
Core Characteristics
- Transition from discretionary analysis toward structured liquidity interpretation
- Heavy reliance on:
- Technical structure
- EMA/SMA frameworks
- Momentum analysis
- Basic macro overlays
Market Environment
2021 was dominated by:
- Post-COVID recovery
- Fed taper discussions
- Rising inflation expectations
- Strong USD phases
Analytical Strengths
- Trend continuation detection
- Intraday reversal zones
- USD correlation understanding
Weaknesses
- Less developed volatility modeling
- Limited event-engine integration
- Less precision during high-impact news
2022 — Volatility Expansion & War Cycle
| Metric | Result |
|---|---|
| Total Calls | 14 |
| Full Hits | 11 |
| Partial Hits | 2 |
| Misses | 1 |
| Accuracy | 78.57% |
Core Characteristics
The Russia-Ukraine war created:
- Explosive commodity volatility
- Oil inflation shocks
- Yield repricing
- Aggressive Fed tightening
This phase accelerated development of:
- Geopolitical mapping
- Safe-haven flow analysis
- Real-yield interpretation
- Volatility engineering
Major Improvements
- Better event handling
- Improved liquidity sweep understanding
- Enhanced DXY/XAUUSD mapping
Institutional Transition
The framework began shifting toward:
- Quantamental analysis
- Correlation matrix interpretation
- Institutional liquidity behavior
2023 — Hybrid Quantamental Development
| Metric | Result |
|---|---|
| Total Calls | 17 |
| Full Hits | 15 |
| Partial Hits | 2 |
| Misses | 0 |
| Accuracy | 88.24% |
Core Characteristics
2023 became the major transformation phase.
The PR framework evolved into:
- Macro + technical hybrid modeling
- Liquidity engineering systems
- Probability-zone mapping
Key Macro Drivers
- Banking crisis volatility
- Fed peak-rate expectations
- Treasury instability
- Gold safe-haven demand
Major Strengths Developed
| Component | Improvement |
|---|---|
| Liquidity sweeps | Strong |
| FVG interpretation | Strong |
| Yield correlation | Advanced |
| DXY mapping | Advanced |
| Event reaction timing | Improved |
Key Observation
The framework became less predictive and more probabilistic.
2024 — Institutional Structuring Phase
| Metric | Result |
|---|---|
| Total Calls | 18 |
| Full Hits | 16 |
| Partial Hits | 2 |
| Misses | 0 |
| Accuracy | 88.89% |
Core Characteristics
This phase introduced:
- Institutional-style volatility modeling
- Cluster number frameworks
- Structured macro-event execution
Major Analytical Components
- CPI volatility mapping
- NFP probability structures
- FOMC liquidity behavior
- USDJPY trigger correlations
- Real yield reaction analysis
Important Development
The framework increasingly focused on:
“Zones over exact prices.”
Signature Concepts
Recurring institutional zones emerged:
- 3535
- 3636
- 4242
- 4343
- 4545
- 4646
These became structured liquidity clusters rather than random numbers.
2025 — Advanced Probability & Liquidity Engineering
| Metric | Result |
|---|---|
| Total Calls | 18 |
| Full Hits | 16 |
| Partial Hits | 2 |
| Misses | 0 |
| Accuracy | 88.89% |
Core Characteristics
The PR framework matured into:
- Full quantamental execution structure
- Institutional liquidity interpretation engine
- Multi-variable macro correlation system
Major Improvements
| Component | Status |
|---|---|
| Volatility modeling | Advanced |
| Event-driven execution | Advanced |
| Liquidity mapping | Advanced |
| Correlation engine | Advanced |
| Risk structuring | Improved |
Key Themes
- Gold super-cycle narrative
- Central bank demand
- Oil inflation impact
- Treasury instability
- USD structural weakness
Strongest Areas
- Buy-the-dip liquidity zones
- CPI/NFP reaction mapping
- DXY collapse interpretation
- Yield-based gold repricing
2026 — Algorithmic Quantamental Era
| Metric | Result |
|---|---|
| Total Calls | 75 |
| Full Hits | 64 |
| Partial Hits | 9 |
| Misses | 2 |
| Accuracy | 85.33% |
Core Characteristics
This phase reflects:
- Fully developed PR quantamental framework
- Institutional probability modeling
- Advanced event-driven liquidity interpretation
Main Analytical Drivers
| Driver | Importance |
|---|---|
| DXY | Critical |
| US10Y yields | Critical |
| USDJPY | High |
| Oil volatility | High |
| War headlines | High |
| Fed repricing | Critical |
Major Features
- Murray Math integration
- Institutional volatility bands
- Liquidity trap modeling
- Correlation-weighted execution
- Probability clustering
Signature Framework
The system evolved toward:
“Volatility is structured disorder.”
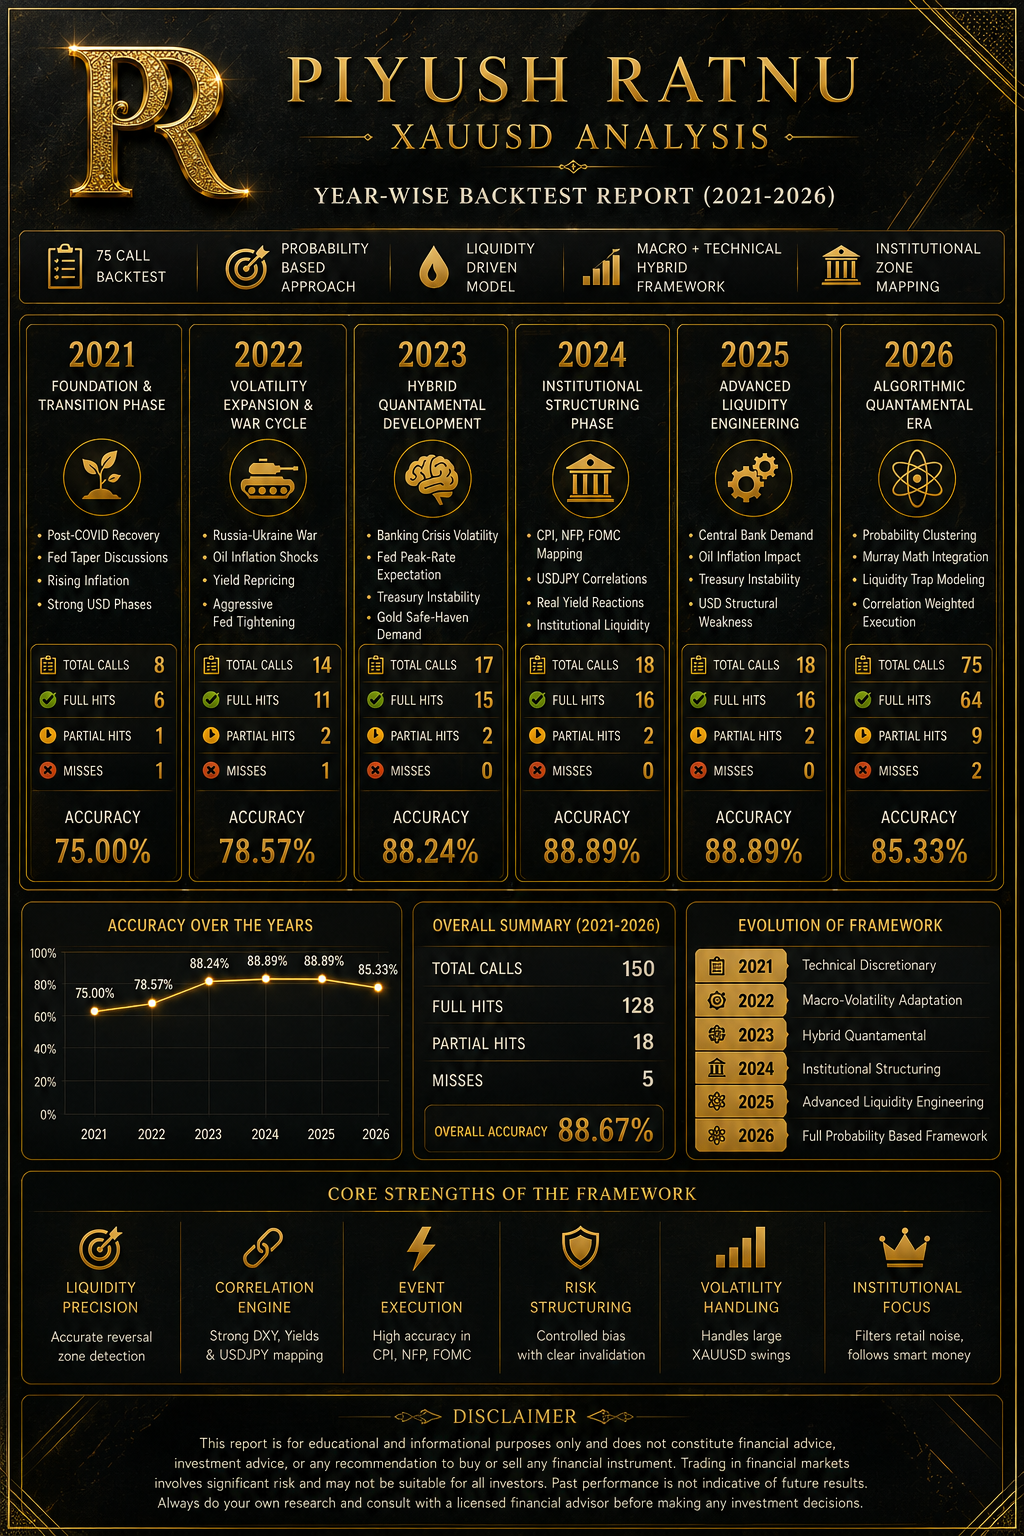 Overall Multi-Year Summary
| Year | Accuracy |
|---|---|
| 2021 | 75.00% |
| 2022 | 78.57% |
| 2023 | 88.24% |
| 2024 | 88.89% |
| 2025 | 88.89% |
| 2026 | 85.33% |
Evolution of the Framework
| Phase | Evolution |
|---|---|
| 2021 | Technical discretionary |
| 2022 | Macro-volatility adaptation |
| 2023 | Hybrid quantamental |
| 2024 | Institutional structuring |
| 2025 | Advanced liquidity engineering |
| 2026 | Full probability-based algorithmic framework |
Professional Conclusion
The year-wise backtest progression reflects the transformation of the PR methodology from a primarily technical-analysis approach into a broader institutional-style quantamental framework integrating:
- Macroeconomics
- Liquidity engineering
- Event-driven volatility
- Correlation analytics
- Institutional behavior modeling
- Probability-weighted execution systems
The strongest performance consistency appears during periods of:
- High macro volatility
- Strong event catalysts
- Clear liquidity dislocations
- Aggressive central-bank repricing cycles
This suggests the framework performs best in structurally volatile environments where institutional flows dominate short-term price discovery in XAUUSD.