
On 19 May, 2022:
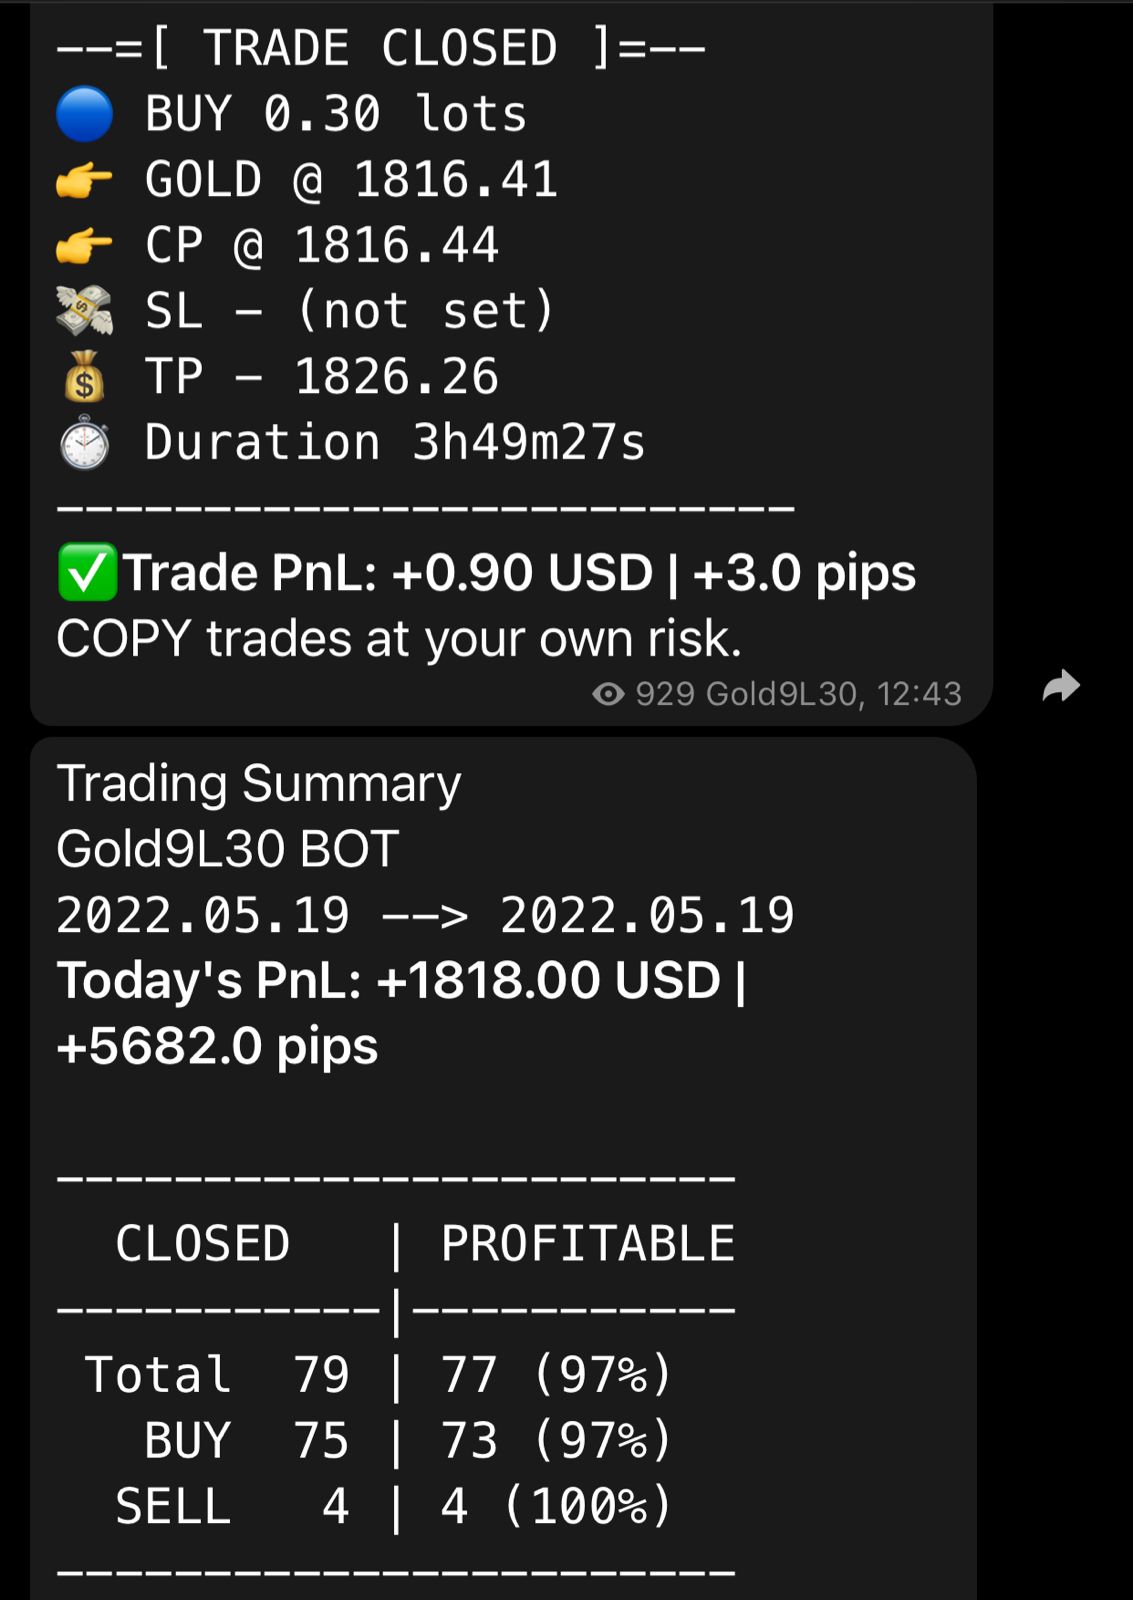
I opened BUY positions on Spot GOLD XAUUSD at 1810 (1808 zone).
TP: 1826.26 was set by me, and CMP is 1826.30
I always believe in booking profits in NET AVERAGE.
Yes, I did hold trades for a longer period, however the analysis and returns were satisfactory.
1810-1826: achieved | S1 to R1 (1819 + 6=1825) NET 1826 Achieved.
Proof:
A significant plunge in the US dollar index (DXY) despite heightened negative market sentiment in the FX domain has supported the gold prices. The DXY has surrendered more than 2.20% gains after printing a 19-year high of 105.00 last week. It worth be worth stating that extremely overbought oscillators have resulted in a meaningful correction in the asset as the solid fundamentals are still intact amid expectations of policy tightening by the Federal Reserve (Fed).
Gold price (XAU/USD) is consolidating below $1,850.00 in a minor range of $1,840.02-1,844.08 in the early Asian session. The precious metal has delivered a perpendicular upside move on Thursday from a low near $1,800.00 as the risk-off impulse favors the precious metal rather than underpinning the greenback. The combination of lower yields, which reduces the “opportunity cost” of holding non-yielding gold, and a weaker US dollar, which reduces the price of USD-denominated commodities like XAU/USD for foreign buyers, is having the dual effect of supporting gold.
The gold prices are forming a Bullish Flag chart pattern that signals a continuation of bullish momentum after a consolidation phase. This consolidation phase denotes an inventory distribution that forces an intensive buying interest from the market participants.
A softer US dollar and weaker US corporate earnings boost Gold’s appeal amidst a dampened sentiment
The factors above-mentioned are a tailwind for Gold. Even though Shanghai is about to reopen after dealing with Covid-19 restrictions for at least a month, other China cities with local flare-ups have increased concerns of further lockdowns. Also, the inflationary scenario started to hit the earnings of big US retailers, which lowered their growth forecasts, despite that Retail Sales, showed the resilience of consumers. That, alongside the possible scenario of stagflation around the US economy, despite Fed’s chief Powell’s confidence that the US economy is strong, boosts the prospects of Gold.
CTA selling flows have largely run their course
“Should prices hold the $1,830 region, CTA funds may begin to add back some length in the shiny metal. But, with downside momentum and the prevailing negative sentiment across precious metals more firmly entrenched, any such buying flows would likely face a high bar to be maintained.”
“Fed Chair Powell’s willingness to take rates beyond neutral in an effort to tame inflation, while sounding tone-deaf regarding economic worries, suggests the path of least resistance for gold is still lower.”
ETF holdings of gold continue to fall for a tenth straight day while positioning analytics still argue for the potential of additional pain for gold bugs.
Technical Analysis:
The Doji candlestick formation on Wednesday, following Tuesday’s decline, likely suggested that bears were losing control. This paved the way for the renewed upside in Gold Price on Thursday, which fuelled a bullish break from the descending trendline resistance at $1,808 on a sustained basis.
The upside breakout and the subsequent daily closing above the 200-DMA reinforced the bullish interests. Although it remains to be seen if bulls can retain control, as the 14-day Relative Strength Index (RSI) continues to inch lower below the midline.
Should the 200-DMA, now support, cave in once again, then Wednesday’s high at $1,825 will emerge as the next cushion for gold buyers. Further south, the $1,810-$1,808 demand area will then come into play, below which the trendline resistance now support at $1,798 will be probed.
Alternatively, five-day highs of $1,849 will be retested on buying resurgence, reopening the upside towards the bearish 21-DMA at $1,862. All in all, gold price is likely to keep its choppy trend intact around the 200-DMA heading into the weekly closing.
HEAVY SELLING should take place above 1866/1888 zone
What it means:
GOLD might crash from 1866/1888/1907 zones to 1836/1818/1808 stops within next 15 days.
M5 M15 FRT 236 NAP as target price on a daily basis
Just like past trend: GOLD is struggling heavily at 1836/1866 zone, the way it struggled while rising to 1947/1966 zone earlier in Feb end and March first week.
 POF
POF
Sell above R1 +6/12 | R2 +6/12
Buy below S1 -6/9 | S2 -6/12
Crash and Rise Scenarios:
C: 1836/1818
R: 1866/1888
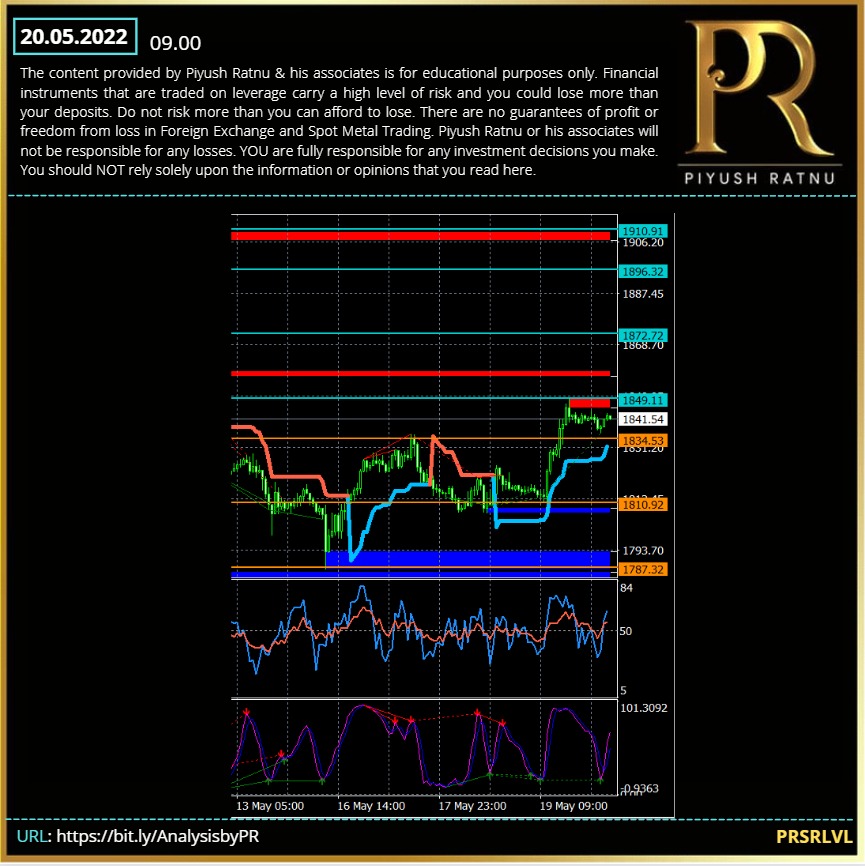
SR ZONES
R1 1849
R2 1872 (1866 zone)
R3 1896 (1907 zone)
S1 1834 (1826 zone)
S2 1810 (1818 zone)
S3 1787 (1777 zone)
Maintain PRICE GAPS: observe MARGIN% carefully.
Implement GR 88 55 33 22 11 or single set.
Targeting NAP, intraday.
MONDAY: market might open with a GAP.
Join TELEGRAM channel for latest updates and market analysis:
If you are on Telegram,
Copy this url and paste in browser: https://bit.ly/AnalysisbyPR
#PiyushRatnu #BullionTrading #Trading #Dubai
The information made available by Piyush Ratnu is for your general information only and is not intended to address your particular requirements. In particular, the information does not constitute any form of advice or recommendation and is not intended to be relied upon by users in making, or refraining from making, any investment decisions.
Read Disclaimer carefully at https://t.me/PiyushRatnuGoldAnalysis/13