XAU/USD $4,460 → $4,325: Correlations, PR Buying Zones & Execution Accuracy
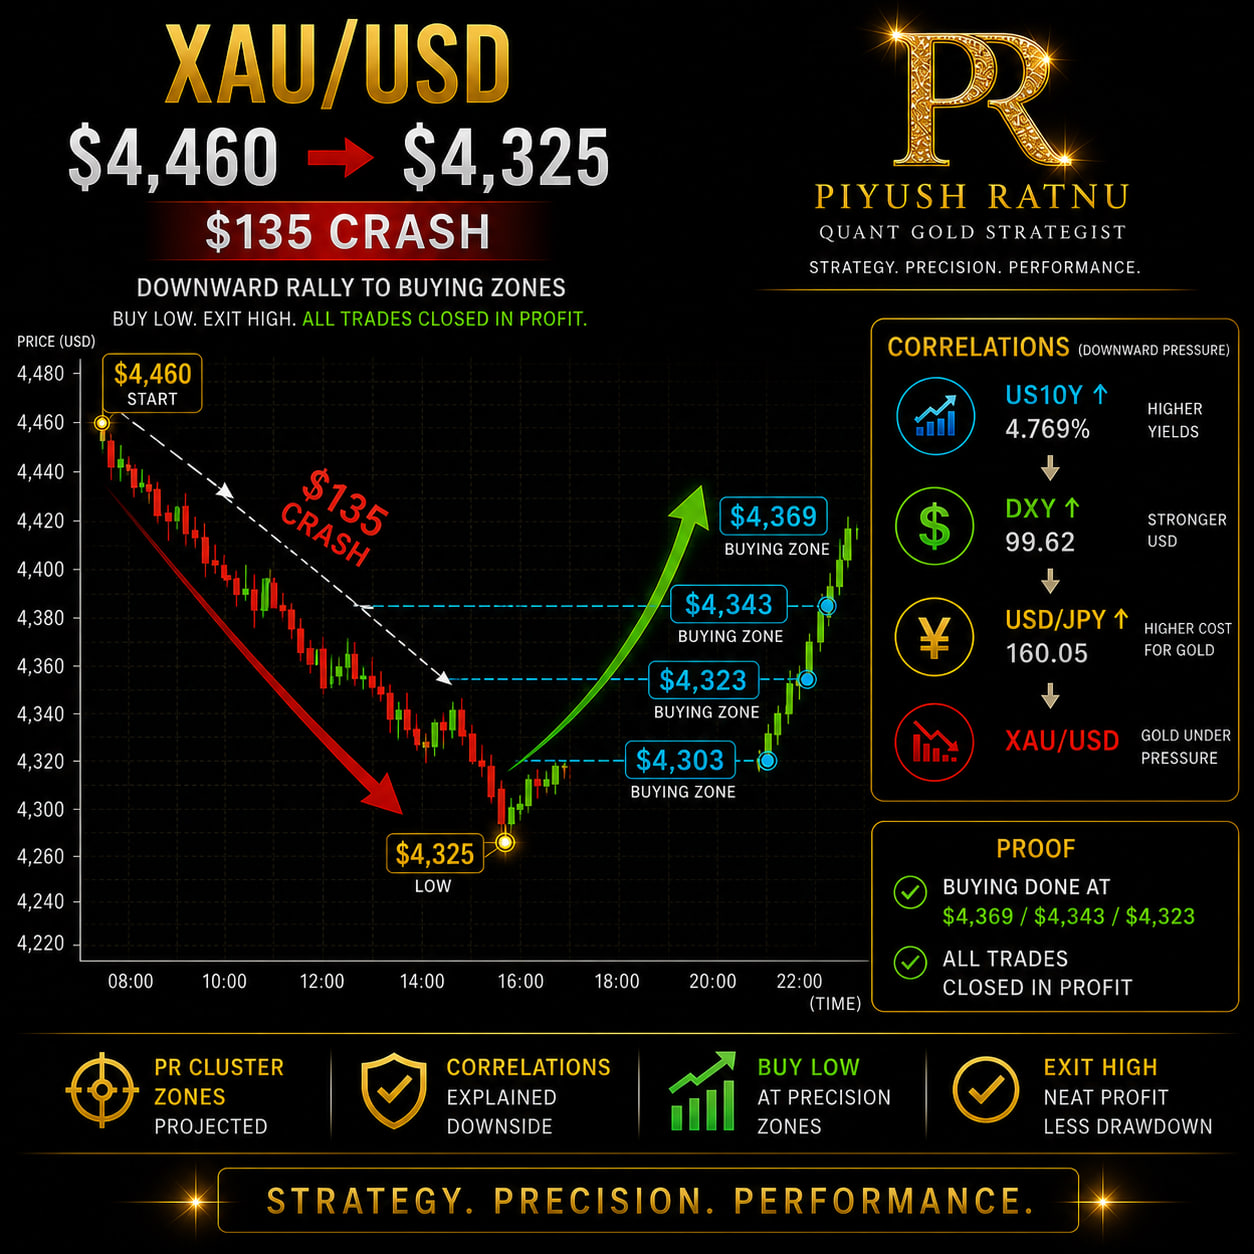
Gold experienced a substantial $135 decline from approximately $4,460 to $4,325, but the importance of this move was not simply the size of the crash. The key was identifying the downside pressure early, mapping predetermined buying zones and executing around those levels rather than reacting emotionally to falling prices.
Ahead of the move, I had highlighted $4,369 / $4,343 / $4,323 / $4,303 as XAU/USD buying zones. The Telegram links supplied provide timestamped posts in the Piyush Ratnu channel, although the public web preview available to me does not expose the actual post text, so readers should inspect the original posts directly to verify the stated levels and timestamps.
Today’s timestamped Telegram post · Previous day’s Telegram post
 Correlations Explained the Downside Pressure
The attached market chart helps explain why Gold remained under pressure. US10Y was around 4.769%, DXY around 99.62 and USD/JPY around 160.05 at the captured point.
The macro transmission mechanism can be viewed as:
US10Y elevated → USD rate advantage supported → DXY supported → USD/JPY elevated → opportunity cost of holding Gold increases → XAU/USD pressured
This is why correlations are valuable. A price level alone tells us where Gold is trading; correlations can help explain why price is moving and whether the surrounding macro environment supports continuation or reversal.
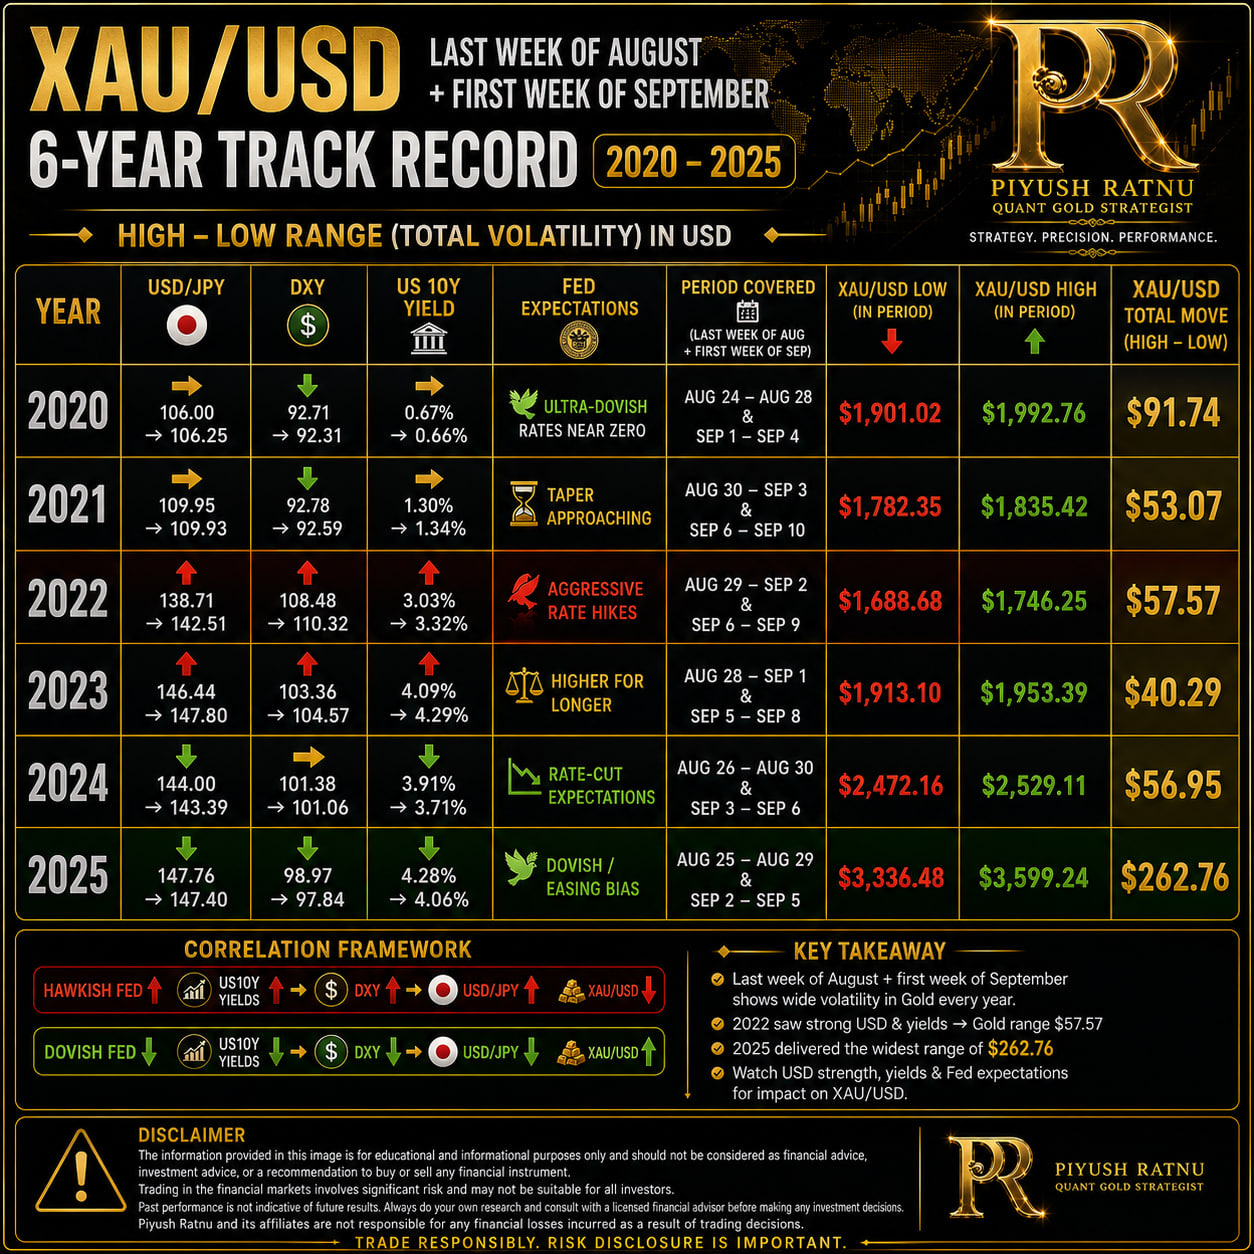 PR Cluster Buying Zones
The projected downside map was:
$4,369 → $4,343 → $4,323 → $4,303
As XAU/USD accelerated lower, these levels provided predefined areas for evaluating BUY opportunities instead of chasing the market during the selloff.
According to the trading results you provided, BUY positions were executed at $4,369, $4,343 and $4,323 and subsequently closed in profit. That is particularly relevant because Gold ultimately printed approximately $4,325, placing the market almost directly on the projected $4,323 PR Cluster Zone.
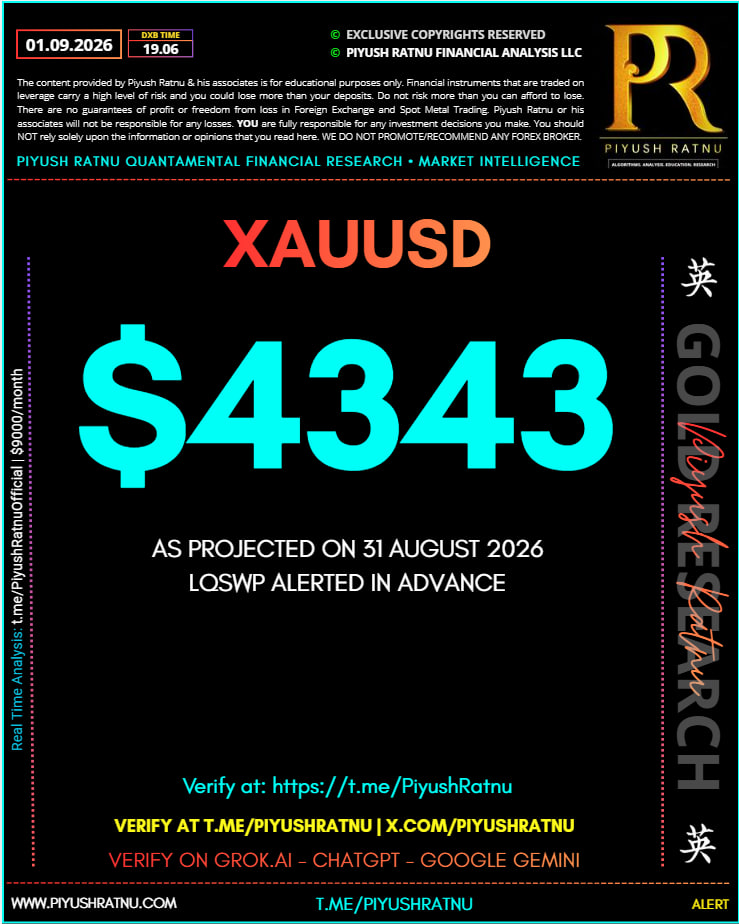 The larger move therefore unfolded:
$4,460 → $4,385/$4,369 → $4,343 → $4,325
with the final low occurring only about $2 above the $4,323 projected level.
Accuracy Is More Than Predicting Direction
The stronger aspect of this example is not merely saying that Gold could decline. A useful trading forecast requires specific price levels, timing, execution and risk management.
In this case, the stated framework combined:
Correlation analysis → downside pressure identified → predetermined PR Cluster Zones → BUY execution at lower levels → profit booking on rebounds.
That distinction matters. Gold fell approximately $135, yet the strategy described here was not based on aggressively shorting the decline. Instead, the approach was to allow the bearish macro pressure to push XAU/USD into predefined lower-price areas and then selectively BUY the lows.
The result, based on the trading record you supplied, was profitable closure of the positions initiated around $4,369, $4,343 and $4,323, while the market ultimately reached approximately $4,325.
From $4,460 to $4,325, the objective was not to predict every dollar of movement—it was to understand the correlations, know the levels in advance, wait for price to reach them and execute with controlled exposure.
PR Cluster Zones | Strategy. Precision. Performance.
Trading involves substantial risk. Historical accuracy and profitable trades do not guarantee future performance.