XAU/USD: Is Gold Building Toward $6,996 and $9,669?
A Long-Term Macro, Correlation and Price-Structure Framework by Piyush Ratnu
XAUUSD Spot Gold: $6363/6996/9669 in next 690 days?
Gold has evolved from being viewed primarily as a defensive asset into one of the most closely watched indicators of monetary confidence, sovereign risk, inflation expectations, geopolitical uncertainty and global liquidity. With XAU/USD trading at historically elevated levels, the central question is no longer simply whether Gold can rise further. The more important question is whether the structural forces behind the advance are powerful enough to sustain a substantially larger multi-year repricing.
Within the Piyush Ratnu XAU/USD framework, $6,996 and $9,669 are long-term upside projections rather than guaranteed destinations. The thesis rests on the interaction of monetary expansion, global debt, central-bank demand, geopolitical instability, currency purchasing-power erosion, real interest rates and Gold’s historical behavior during major monetary cycles.
At the same time, a bullish long-term thesis should never be confused with an expectation that Gold will move vertically upward. XAU/USD can experience violent corrections even within a secular bull market. For this reason, the framework also identifies important downside reference zones at $4,343, $4,242, $4,141, $4,040, $3,939, $3,838 and $3,737.
The objective is therefore not to predict a straight line to $6,996 or $9,669. It is to create a structured roadmap for assessing whether the macroeconomic environment, intermarket correlations and price action continue to validate—or invalidate—the long-term bullish hypothesis.
The Bullish Case for Gold
1. Monetary Expansion
One of the most important components of the long-term Gold thesis is the expansion of the global monetary system.
Over long periods, growth in money and credit can increase the nominal value of scarce assets. Gold is particularly important in this context because its physical supply cannot be expanded in the same manner as fiat currency or bank credit.
This does not mean that every increase in money supply immediately produces a rally in XAU/USD. Monetary transmission is far more complicated. Interest rates, inflation expectations, economic growth, liquidity preferences and investor positioning all influence the final outcome.
The structural argument is instead that when monetary liabilities grow substantially faster than the available stock of scarce monetary assets, investors may increasingly seek assets capable of preserving purchasing power.
Gold has historically occupied that role.
The significance of monetary expansion therefore becomes greater when it is combined with other factors—especially declining real yields, currency weakness, fiscal concerns or financial instability.
2. Global Debt Expansion
The second pillar is the extraordinary scale of global public and private debt.
Debt by itself is not automatically bullish for Gold. A productive economy can support large quantities of debt when income and economic output are expanding sufficiently.
The potential problem arises when debt servicing becomes increasingly dependent upon refinancing, lower real borrowing costs, monetary accommodation or persistent fiscal deficits.
This creates a difficult policy balance.
If interest rates remain very high for an extended period, governments, businesses and households face greater financing pressure. If policymakers respond with easier monetary conditions, the resulting decline in real rates or currency purchasing power can become supportive for Gold.
Gold therefore becomes particularly interesting when markets begin questioning the sustainability of fiscal trajectories.
The thesis behind the $6,996 and $9,669 projections assumes that the coming years could involve continuing tension between high debt burdens and the monetary policies required to manage them.
That is a structural argument—not a short-term trading signal.
3. Geopolitical Instability
Gold also operates as a geopolitical risk asset.
Wars, sanctions, trade disputes, disruptions to energy supplies, reserve diversification and deterioration in relationships between major economies can increase demand for assets perceived as politically neutral or independent of another country’s liabilities.
The important point is not that every geopolitical headline sends Gold higher.
Markets frequently price geopolitical developments very quickly, and safe-haven rallies can reverse when immediate fears subside.
The longer-term impact becomes more significant when geopolitical fragmentation begins changing how governments and institutions manage reserves.
If countries increasingly prioritize diversification, liquidity and assets with limited counterparty exposure, physical Gold can acquire greater strategic importance.
This is why geopolitical risk is treated in the Piyush Ratnu framework as a structural variable, rather than merely a source of temporary volatility.
4. Central-Bank Gold Accumulation
Central-bank behavior deserves special attention because official-sector demand can influence the long-term structure of the Gold market.
Central banks hold Gold for reasons different from those of short-term traders. They may use it for reserve diversification, confidence, liquidity, protection against monetary uncertainty and reduction of dependence on individual currencies or sovereign issuers.
Persistent official-sector accumulation can consequently create an underlying source of demand that is relatively insensitive to the technical indicators watched by retail traders.
This does not eliminate corrections.
Central-bank buying cannot guarantee that Gold will rise every month or every year.
However, if strong official demand continues while mine supply remains relatively constrained, it strengthens the argument that Gold’s long-term equilibrium price may need to adjust upward to balance global demand and available supply.
5. Fiat Currency Purchasing-Power Erosion
Gold should not be evaluated solely by asking whether its dollar price is increasing.
Another way to view the relationship is to ask what is happening to the purchasing power of the currency in which Gold is denominated.
Over very long periods, inflation causes fiat currencies to purchase fewer goods and services. Gold’s limited physical supply is one reason investors have historically considered it a potential store of value across monetary regimes.
The relationship is not perfect over shorter periods.
Gold can fall while inflation is elevated, particularly when central banks aggressively increase real interest rates or the US Dollar appreciates.
This distinction is critical.
Inflation alone is not enough.
The interaction among inflation, nominal yields, real yields and the Dollar is much more important.
6. Historical Bull-Market Behavior
Historical comparison provides another part of the framework.
Major Gold bull markets have rarely developed as smooth advances. They have typically contained corrections, consolidation phases, volatility expansions and powerful continuation moves.
For example, the 2001–2011 Gold cycle represented a dramatic long-term repricing. The 2015–2020 period produced another substantial advance, while the subsequent cycle pushed Gold into new nominal territory.
Historical performance does not prove that the next cycle will behave in the same way.
What history demonstrates is something different:
Gold is capable of undergoing very large percentage repricing when monetary, macroeconomic and confidence conditions align.
This is the logic behind studying $6,996 and $9,669 as potential long-range extensions rather than dismissing such prices simply because they appear distant from current levels.
The Correlation Framework Behind the Gold Outlook
Price targets become much more useful when accompanied by conditions that can either confirm or contradict them.
Piyush Ratnu’s approach therefore places considerable emphasis on intermarket relationships.
DXY — US Dollar Index
The US Dollar is one of the most important variables affecting XAU/USD.
Because Gold is predominantly quoted in dollars, the two assets frequently demonstrate an inverse relationship.
A weaker DXY can make Gold less expensive for holders of other currencies while simultaneously indicating a reduction in relative demand for the Dollar. This can support XAU/USD.
The simplified relationship is:
DXY ↓ → XAU/USD potentially ↑
and:
DXY ↑ → XAU/USD potentially pressured
But this is a tendency rather than a fixed rule.
There are periods when both Gold and the Dollar rise simultaneously—particularly during severe global risk events when investors demand multiple forms of liquidity and protection.
Therefore, DXY should be analyzed as part of a correlation matrix rather than as a standalone trading signal.
US 10-Year Treasury Yield
The US 10-year Treasury yield is another major variable.
Gold itself pays no coupon. When Treasury yields rise significantly, the opportunity cost of holding non-yielding Gold can increase.
Conversely, declining Treasury yields can reduce that opportunity cost.
A simplified relationship is:
US10Y ↓ → potentially supportive for Gold
US10Y ↑ → potentially restrictive for Gold
Yet nominal yields do not tell the entire story.
What ultimately matters even more is the return available after accounting for inflation.
That leads directly to real yields.
Real Yields: One of Gold’s Most Important Macro Signals
Real interest rates can be approximated conceptually as nominal interest rates adjusted for expected inflation.
For Gold, this relationship is particularly important.
When real yields are high, investors can potentially earn an attractive inflation-adjusted return from interest-bearing assets.
When real yields decline sharply or become deeply negative, the opportunity cost associated with holding Gold decreases.
Hence:
Real yields ↓ → generally supportive for Gold
Real yields ↑ → generally challenging for Gold
A powerful long-term Gold scenario would therefore be strengthened if nominal yields fall, inflation expectations remain elevated and real yields decline simultaneously.
This is one of the combinations that should be monitored closely when evaluating the probability of substantially higher XAU/USD valuations.
USD/JPY as a Cross-Market Signal
USD/JPY forms another important component of the Piyush Ratnu correlation methodology.
The pair reflects a complicated interaction among US yields, Japanese yields, monetary-policy divergence, global risk appetite and carry-trade positioning.
A major decline in USD/JPY can sometimes accompany falling US yields, changing rate expectations or the unwinding of leveraged carry trades.
Under the appropriate conditions, these developments can coincide with strength in Gold.
This does not mean that USD/JPY mechanically controls XAU/USD.
Instead, USD/JPY acts as an additional confirmation variable.
Ratnu’s methodology therefore focuses on whether movements in USD/JPY are being confirmed by DXY, Treasury yields, liquidity conditions and XAU/USD price structure.
The more variables that align, the stronger the macro signal can become.
Oil Prices and Gold
Oil can affect Gold through the inflation channel.
A sustained increase in crude-oil prices can raise transportation, manufacturing and energy costs, potentially increasing inflation expectations.
If inflation expectations rise faster than nominal yields, real yields can decline.
That environment may support Gold.
The sequence can therefore become:
Oil ↑ → Inflation expectations ↑ → Real yields ↓ → Gold supported
But again, the relationship is conditional.
If rising oil prices cause central banks to become dramatically more hawkish and real rates rise, the resulting effect on Gold could be very different.
This illustrates why correlation analysis must examine the entire chain rather than a single market.
Inflation Expectations
Gold frequently responds more strongly to changes in future inflation expectations than to inflation numbers that markets have already anticipated.
If investors begin expecting persistent inflation while simultaneously anticipating easier monetary policy, Gold can benefit from both sides of the equation.
This is especially important around:
- CPI
- Core CPI
- PPI
- Core PCE
- FOMC decisions
- employment data
- GDP
- retail sales
- Treasury-market developments.
The actual number is only the first part of the analysis.
The market reaction is the second—and often more important—part.
A supposedly bullish inflation number that fails to push Gold higher can itself contain valuable information about positioning and market structure.
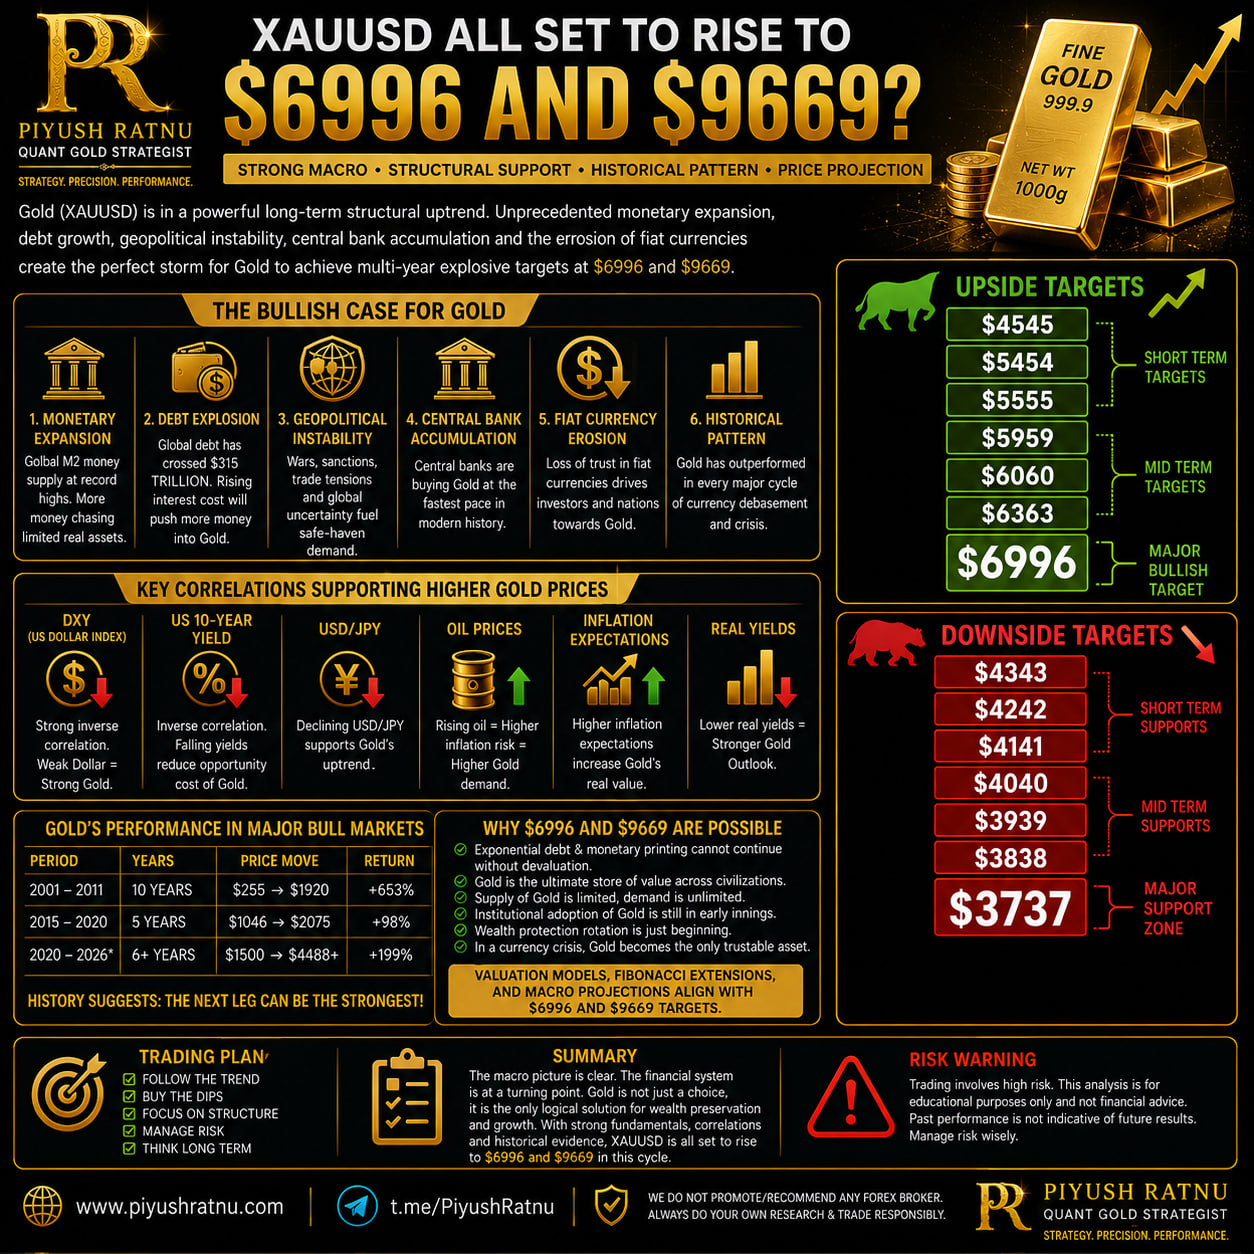 The Upside XAU/USD Roadmap
The infographic identifies a sequence of upside reference levels:
$4,545 → $5,454 → $5,555 → $5,959 → $6,060 → $6,363 → $6,996
These levels should not be interpreted as guaranteed sequential targets.
They represent areas at which price behavior can be reassessed.
The first group—$4,545, $5,454 and $5,555—can be considered nearer structural objectives within the broader bullish framework.
The next group—$5,959, $6,060 and $6,363—represents a more substantial expansion of the bull market.
Finally, $6,996 represents the major bullish objective shown in the current roadmap.
Beyond this sits the much more ambitious $9,669 long-term projection.
For $9,669 to become increasingly credible, Gold would probably need more than technical momentum. The macro environment would need to provide sustained structural support through some combination of monetary expansion, falling real yields, reserve diversification, persistent central-bank demand, fiscal concerns and declining confidence in fiat purchasing power.
The Downside Roadmap Cannot Be Ignored
A credible bullish analysis must also define what happens when the market moves in the opposite direction.
The downside levels identified are:
$4,343 → $4,242 → $4,141 → $4,040 → $3,939 → $3,838 → $3,737
These levels provide a framework for measuring corrections and structural deterioration.
The first three levels—$4,343, $4,242 and $4,141—represent nearer downside reference zones.
Below them, $4,040, $3,939 and $3,838 become increasingly important.
The $3,737 region represents the major support zone in the illustrated framework.
A decline toward these prices would not automatically invalidate a multi-year bullish thesis. The more important question would be how Gold reaches those levels and how the broader macro variables behave simultaneously.
A major difference exists between a liquidity-driven correction inside a secular bull market and a structural reversal accompanied by rising real yields, persistent Dollar strength and deterioration in investment demand.
That distinction is central to professional risk analysis.
Why $6,996 and $9,669 Should Be Treated as Scenarios, Not Promises
Long-term forecasting is inherently uncertain.
No valuation model, Fibonacci projection, macroeconomic model or historical comparison can guarantee a future Gold price.
The correct way to use targets such as $6,996 and $9,669 is therefore probabilistically.
Ask:
What would need to happen for these targets to become increasingly probable?
Then monitor whether those conditions actually develop.
A strengthening bullish case could include:
- declining real yields;
- a structurally weaker Dollar;
- sustained central-bank accumulation;
- continuing monetary expansion;
- growing sovereign debt concerns;
- persistent inflation expectations;
- geopolitical fragmentation;
- strong institutional demand;
- and XAU/USD maintaining its long-term bullish market structure.
Conversely, persistent high real yields, strong Dollar appreciation, reduced investment demand and decisive technical breakdowns would force the bullish thesis to be reassessed.
This is far more robust than simply declaring that Gold “must” reach a particular number.
Trading Philosophy: Follow Structure, Not Emotion
The practical trading framework illustrated alongside the outlook is deliberately simple:
Follow the trend. Buy strategically into weakness. Focus on structure. Manage risk. Think long term.
The most important principle is risk management.
Even a correct long-term forecast can produce substantial losses when executed with excessive leverage, oversized positions or poor timing.
A trader can be right about the destination and still be wrong about the path.
Gold routinely experiences large intraday and multi-week corrections. Consequently, position size, leverage, drawdown tolerance, liquidity and invalidation levels should always be considered before execution.
Forecasting and trading are related disciplines, but they are not identical.
Piyush Ratnu — Quant Gold Strategist
Piyush Ratnu’s research is centered specifically on Gold (XAU/USD), with an emphasis on combining macroeconomic analysis, cross-market correlations, liquidity behavior, price structure and predefined price zones.
Rather than evaluating Gold through a single technical indicator, the methodology studies multiple markets simultaneously. Particular attention is given to DXY, USD/JPY, US Treasury yields, real yields, inflation expectations and major US macroeconomic events such as CPI, PPI, NFP and FOMC decisions.
The underlying philosophy is that Gold should not be analyzed in isolation.
A price target becomes more meaningful when multiple independent variables begin pointing toward the same outcome.
This is why the approach combines fundamental forecasting with technical structure and correlation analysis.
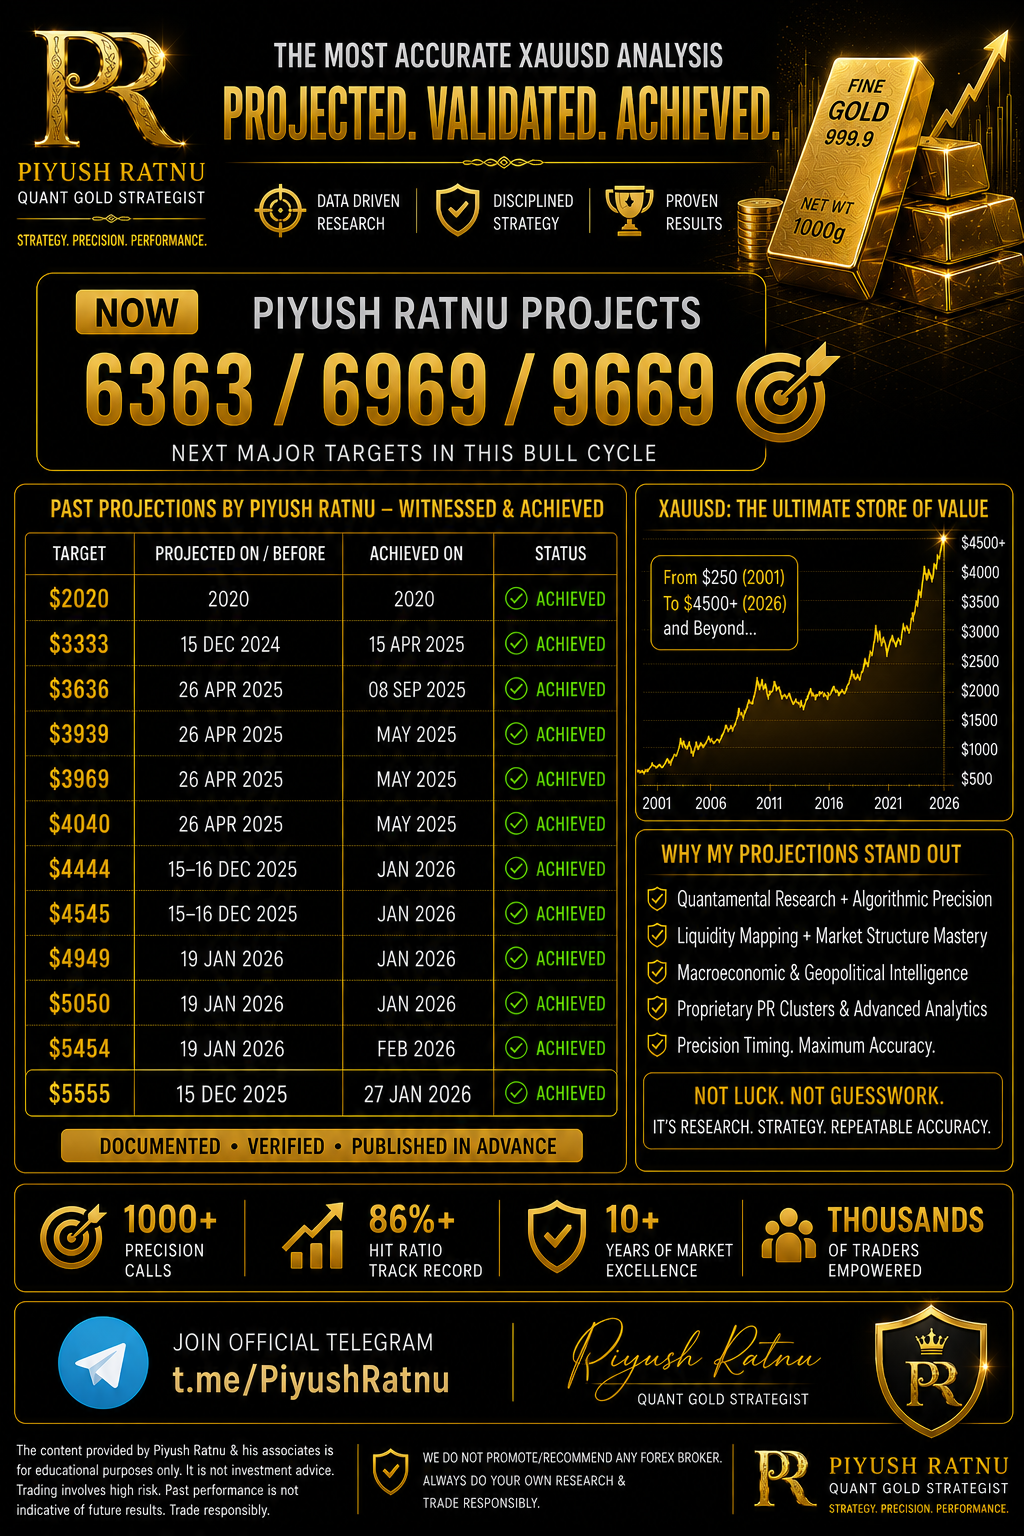
 Accuracy and Past Target Review
A major component of Ratnu’s work is the practice of publishing specific XAU/USD zones in advance and subsequently comparing those projections with realized market prices.
Examples highlighted across the published research include major zones such as $4,585/$4,545, $4,669/$4,646, $4,488, $4,444/$4,422/$4,404, $4,242, $4,069, $3,989, $3,969 and $4,343, among others.
The methodology also emphasizes event-specific forecasting around CPI, PPI, NFP, FOMC and movements in correlated markets such as USD/JPY.
One particularly important principle of an accuracy review is that a forecast should be judged against what was actually published before the market move—not reconstructed afterward.
A rigorous track record should therefore preserve the original publication date and timestamp, projected price or range, market price at publication, subsequent high/low, time taken to reach the target, tolerance used to define a “hit,” and any targets that were not achieved.
This distinction is important when interpreting any claimed success rate.
Ratnu’s own historical review has presented a strong proportion of achieved or closely approached XAU/USD price zones. However, unless a performance dataset has been independently audited under a predefined methodology, such figures should be described as a published/self-reviewed forecasting track record rather than an independently verified investment-performance statistic.
That distinction does not diminish the usefulness of reviewing historical calls. It makes the analysis more credible by separating documented forecasts from promotional claims.
Ultimately, the objective of the Piyush Ratnu methodology is not merely to predict whether Gold will rise or fall.
It is to identify price, direction, timing, macro catalysts and correlated-market confirmation together.
And that same discipline must now be applied to the largest projections in the current framework.
$6,996 and $9,669 are possibilities—not certainties.
If monetary conditions, real yields, DXY, USD/JPY, central-bank demand, geopolitical forces and XAU/USD market structure progressively align, the probability of a much larger Gold repricing could increase.
If those variables diverge, the targets must be questioned.
That is the central principle behind the outlook:
Do not trade the target alone. Trade the evidence that either confirms or invalidates it.
Risk Disclosure: XAU/USD is highly volatile and leveraged trading can result in substantial losses. Long-term price projections are forward-looking scenarios, not guarantees of future performance. Historical forecasts and past market behavior do not guarantee future results. This material is for research and educational purposes and should not be interpreted as personalized financial advice.