When the U.S. Government Buys Its Own Debt: Yield-Curve Control, Liquidity and the Implications for XAU/USD
By Piyush Ratnu | Quant Gold Strategist | Quantamental Financial Research
The U.S. Treasury market has become an increasingly important variable in my XAU/USD framework. Gold should not be analysed through price action alone: Treasury yields, real rates, DXY, USD/JPY, inflation expectations, fiscal policy, liquidity and geopolitical risk interact to determine the opportunity cost and monetary environment surrounding Gold.
The latest development deserves particular attention. On August 19, the U.S. Treasury announced that liquidity-support buybacks of 10–30 year nominal Treasury securities will increase from a maximum of $2 billion to at least $4 billion per operation, beginning September 9, 2026. Long-term yields immediately declined, the yield curve flattened, the Dollar weakened and Gold rallied sharply.
What actually happens when the Treasury buys back its own debt?
A Treasury buyback means the government purchases outstanding Treasury securities from investors before those securities mature. Importantly, this is not automatically money printing, QE or formal Yield Curve Control.
The current Treasury program is primarily a debt-management and market-liquidity operation. Buying older or less-liquid securities can improve Treasury-market functioning and reduce liquidity premiums. The government can simultaneously finance itself by issuing other Treasury securities, so the operation can change the composition of outstanding debt rather than simply making government debt disappear.
That distinction matters enormously.
Treasury buyback ≠ Federal Reserve QE.
Under QE, the Federal Reserve purchases securities and expands its balance sheet, normally creating reserve balances in the banking system. A Treasury buyback is conducted by the Treasury as part of debt management and does not mechanically create central-bank money. Current reporting similarly emphasizes that the expanded buybacks should not be treated as conventional QE.
Nevertheless, markets care about the price signal.
When a large official buyer increases demand for longer-duration Treasuries:
Bond demand ↑ → Bond prices ↑ → Yields ↓
And that can transmit directly into Gold.
What Is Yield Curve Control?
Yield Curve Control (YCC) goes substantially further.
Under genuine YCC, a central bank targets a particular government-bond yield—or part of the yield curve—and commits to purchasing enough securities to prevent yields from moving materially above that desired level.
Conceptually:
QE targets the quantity of asset purchases. YCC targets the price/yield.
For example, imagine the central bank effectively decides that a 10-year Treasury yield above a certain threshold is inconsistent with its policy objective.
If investors sell Treasuries and the 10-year yield rises above that threshold, the central bank purchases bonds.
Selling pressure → Yield rises → Official purchases → Bond price rises → Yield falls
If the commitment is credible, traders may eventually stop aggressively challenging the target because they know they are trading against a potentially very large official balance sheet.
Is the current Treasury buyback program YCC?
No—not formally.
The Treasury has not announced a specific yield ceiling that it promises to defend, and the Treasury itself does not conduct Federal Reserve monetary policy.
However, markets may interpret increasingly aggressive long-duration buybacks as a soft attempt to reduce disorderly upward pressure on long-term borrowing costs. That distinction should be maintained: calling the current program outright YCC would overstate what has actually been announced.
The initial market reaction nevertheless looked YCC-like in one important respect: long yields fell sharply after the announcement. The 10-year reportedly moved from roughly 4.68% toward 4.65%, while the 30-year fell from approximately 5.27% toward 5.20%.
Why This Matters So Much for XAU/USD
Gold produces no coupon.
Consequently, Treasury yields—and particularly real yields—represent an important component of Gold’s opportunity cost.
When investors can earn increasingly attractive inflation-adjusted returns from U.S. government securities, holding non-yielding Gold becomes comparatively less attractive.
When yields decline, that opportunity-cost disadvantage diminishes.
The World Gold Council has historically found an important inverse relationship between Gold and interest rates, while noting that the relationship changes across market regimes. It also finds Gold’s inverse relationship with the U.S. Dollar to be more consistently negative.
That gives us the first major transmission channel:
Treasury buying ↑
↓
Treasury prices ↑
↓
Long-term yields ↓
↓
Real-yield pressure potentially ↓
↓
Gold opportunity cost ↓
↓
XAU/USD ↑
But that is only half of the Quantamental equation.
The Dollar Transmission Mechanism
Lower U.S. yields can reduce the relative yield advantage available from Dollar-denominated assets.
That can weaken demand for the USD, particularly when yields fall faster than those available in competing currencies.
The sequence then becomes:
US10Y ↓ → USD yield advantage ↓ → DXY ↓ → XAU/USD ↑
This combination can become particularly powerful because Gold receives support from two directions simultaneously:
lower yields + weaker Dollar.
That appears relevant to the August 19 market reaction. Reuters reported that the Dollar weakened significantly while Gold surged above $4,500 following the Treasury announcement.
The USD/JPY Correlation
USD/JPY provides another useful confirmation variable within my XAU/USD framework.
When U.S. yields decline rapidly, the U.S.–Japan yield differential can compress.
That can produce:
US yields ↓ → USD/JPY ↓ → USD weakness confirmation → Gold support
This relationship is not mechanical, because Bank of Japan policy and Japanese yields also determine USD/JPY.
But when I observe simultaneously:
DXY ↓
US10Y ↓
USD/JPY ↓
while Gold maintains bullish market structure, the cross-market confirmation becomes considerably stronger.
My simplified correlation equation becomes:
US10Y ↓ + Real Yields ↓ + DXY ↓ + USD/JPY ↓ = XAU/USD ↑
There Is Also a Fiscal-Debasement Channel
This is where Gold becomes particularly interesting.
If investors conclude that authorities are becoming increasingly uncomfortable with high government borrowing costs, they may begin questioning how long real yields can remain restrictive while public debt continues expanding.
If the market eventually interprets official bond purchases as moving from liquidity management toward deliberate financial repression or yield suppression, Gold can attract an additional monetary-risk premium.
The mechanism becomes:
Government debt ↑ → Interest expense ↑ → Pressure to contain yields ↑ → Real-return concerns ↑ → Demand for alternative monetary assets ↑ → Gold ↑
The World Gold Council has noted that fiscal concerns can support Gold as investors diversify toward alternative safe-haven assets, although real yields are only one of several Gold drivers.
The Inflation Paradox
Lower yields are normally supportive for Gold.
But there is a second possibility.
Suppose policymakers suppress long-term yields while:
Oil ↑ + inflation ↑ + fiscal deficits ↑
Then nominal yields could remain contained while inflation expectations increase.
That means:
Real yield = Nominal yield − Expected inflation
For illustration:
Nominal 10Y = 4.5%
Expected inflation = 3.0%
Real yield ≈ 1.5%
If nominal yields remain around 4.5% while inflation expectations increase to 4%:
Real yield ≈ 0.5%
That is potentially much more supportive for Gold.
This is why the combination of yield suppression + persistent inflation + fiscal expansion deserves close attention from precious-metals traders.
Middle East + Oil Adds Another Variable
There is an additional complication.
If geopolitical tensions keep crude oil elevated, energy prices can feed into inflation expectations.
The potential chain becomes:
Middle East risk ↑ → Crude Oil ↑ → Inflation expectations ↑ → Real yields ↓ if nominal yields are restrained → Gold ↑
There is also a direct safe-haven channel:
Geopolitical uncertainty ↑ → Defensive demand ↑ → Gold demand ↑
However, the relationship is not one-directional. If higher oil prices force the Federal Reserve to become materially more hawkish and nominal/real yields subsequently rise sharply, part of Gold’s initial geopolitical advantage could be offset.
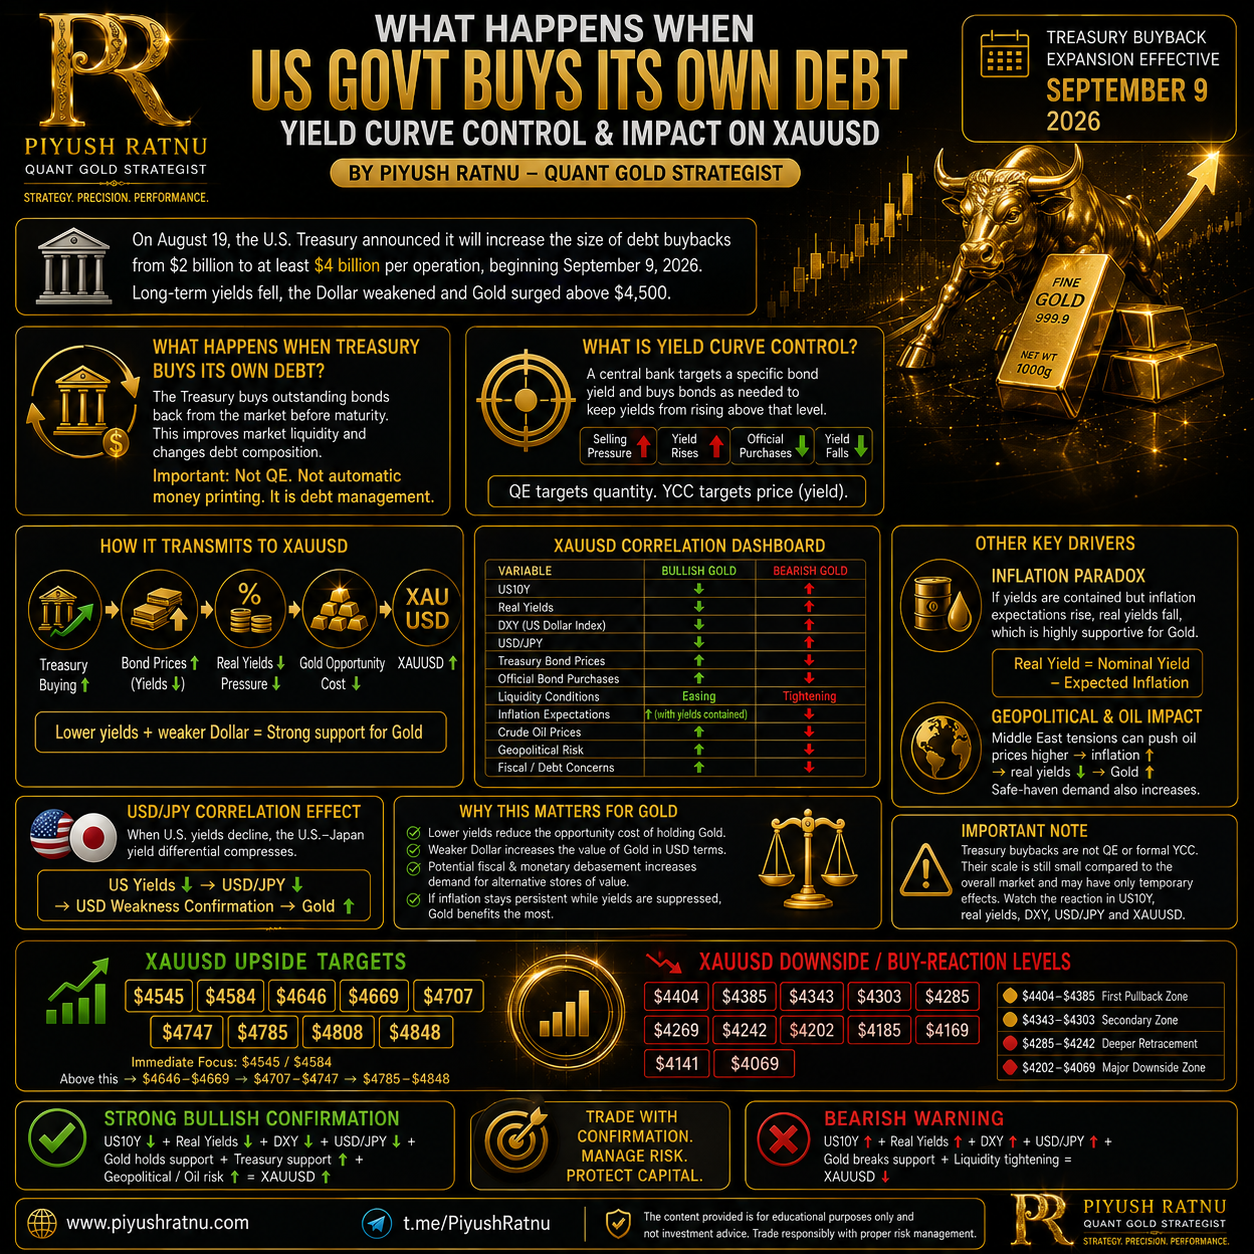 My XAU/USD Correlation Dashboard
| Variable | Bullish Gold Condition | Bearish Gold Condition |
|---|---|---|
| US10Y | ↓ | ↑ |
| Real yields | ↓ | ↑ |
| DXY | ↓ | ↑ |
| USD/JPY | ↓ | ↑ |
| Treasury bond prices | ↑ | ↓ |
| Official bond purchases | ↑ supportive | ↓ / withdrawn |
| Liquidity conditions | Easing | Tightening |
| Inflation expectations | ↑ with yields contained | ↓ |
| Crude Oil | ↑ inflation/geopolitical premium | ↓ risk premium |
| Geopolitical risk | ↑ safe-haven demand | ↓ |
| Fiscal/debt concerns | ↑ alternative-store-of-value demand | Stabilisation |
These are conditional correlations rather than fixed laws. Gold can rise alongside yields or the Dollar when fiscal, geopolitical, central-bank or safe-haven demand overwhelms traditional relationships.
XAU/USD Forward Price Map — Piyush Ratnu
Rather than treating a single price as a guaranteed target, I would structure the supplied levels as a scenario ladder.
UPSIDE CLUSTER
$4,545 → $4,584 → $4,646 → $4,669 → $4,707 → $4,747 → $4,785 → $4,808 → $4,848
The immediate focus is $4,545 / $4,584.
Sustained acceptance above this region would expose the $4,646–$4,669 cluster.
A continuation of declining yields, Dollar weakness and supportive liquidity conditions could then bring the $4,707–$4,747 region into consideration.
The larger bullish extension becomes:
$4,785 → $4,808 → $4,848
DOWNSIDE / BUY-REACTION MAP
$4,404 → $4,385 → $4,343 → $4,303 → $4,285 → $4,269 → $4,242 → $4,202 → $4,185 → $4,169 → $4,141 → $4,069
I would divide this into four structural clusters:
$4,404–$4,385 — first pullback zone
$4,343–$4,303 — secondary structural zone
$4,285–$4,242 — deeper retracement zone
$4,202–$4,069 — major downside/liquidity structure
These should be treated as levels to reassess price action and correlations, not automatic buy orders.
What Would Strengthen the Bullish XAU/USD Case?
My bullish scenario would receive stronger confirmation if several conditions develop together:
US10Y continues declining + DXY remains weak + USD/JPY falls + real yields soften + Gold holds reclaimed support + Treasury-market intervention expands + geopolitical/oil risks remain elevated.
Under that combination, the probability structure progressively shifts toward:
$4,545 → $4,584 → $4,646/$4,669 → $4,707/$4,747 → $4,808/$4,848
Conversely, a renewed surge in Treasury yields accompanied by DXY ↑ + USD/JPY ↑ + real yields ↑ would warn that the supportive correlation regime is breaking down.
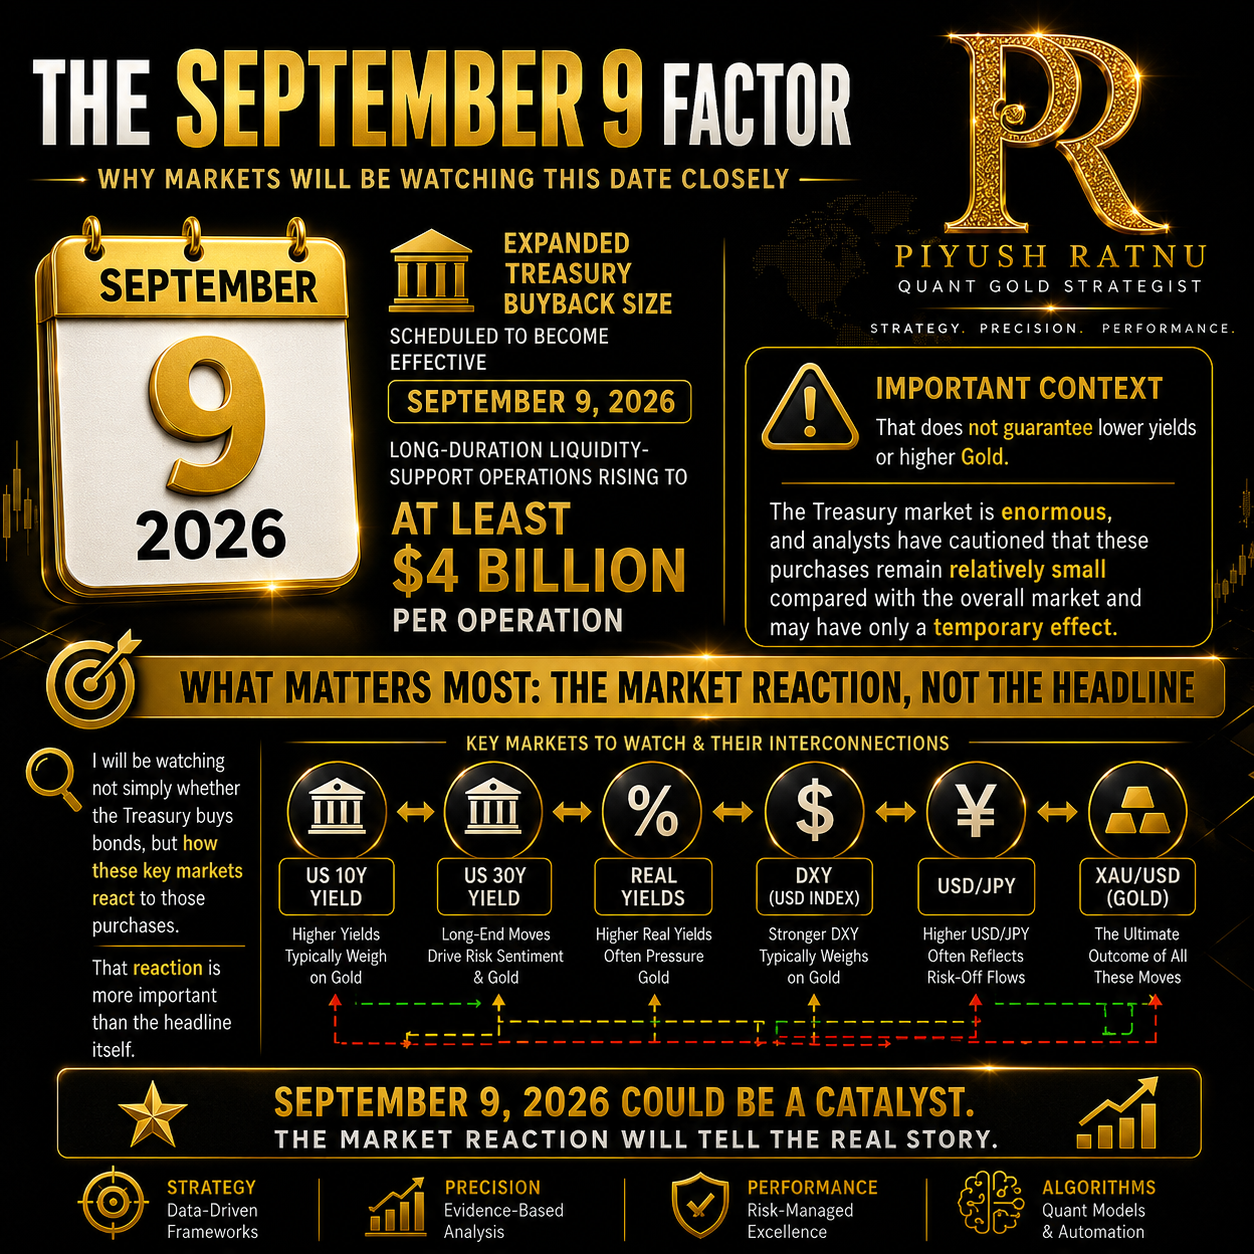 The September 9 Factor
This is the date I would monitor particularly closely.
The expanded Treasury buyback size is scheduled to become effective September 9, 2026, with long-duration liquidity-support operations rising to at least $4 billion per operation.
That does not guarantee lower yields or higher Gold.
The Treasury market is enormous, and analysts have cautioned that these purchases remain relatively small compared with the overall market and may have only a temporary effect.
Therefore, I will be watching not simply whether the Treasury buys bonds, but how US10Y, US30Y, real yields, DXY, USD/JPY and XAU/USD react to those purchases.
That reaction is more important than the headline itself.
Conclusion — Piyush Ratnu
The expansion of U.S. Treasury buybacks introduces an important new variable into the XAU/USD Quantamental framework. It should not be confused with Federal Reserve QE or formal Yield Curve Control, but its immediate ability to support long-duration Treasury prices, compress yields and influence the Dollar means Gold traders cannot ignore it.
The potentially powerful Gold configuration is:
Treasury support ↑ → Bond prices ↑ → US yields ↓ → Real yields ↓ → DXY ↓ → USD/JPY ↓ → XAU/USD ↑
If that sequence develops alongside persistent fiscal concerns, elevated energy prices and geopolitical uncertainty, the environment could remain structurally constructive for Gold.
But my methodology remains confirmation-driven: price action + liquidity + Treasury yields + DXY + USD/JPY + macro fundamentals + geopolitical risk must be evaluated together.
— Piyush Ratnu
Quant Gold Strategist | XAU/USD Analyst & Trader
Quantamental Financial Research • Market Intelligence
The price levels above are scenario levels supplied for this analysis, not guaranteed forecasts or investment advice.