How to Trade XAUUSD on FOMC Day: A Complete Gold Trader’s Guide
By Piyush Ratnu | Quant Gold Strategist
The Federal Open Market Committee meeting is one of the most important events for XAU/USD traders because the Federal Reserve’s decision can simultaneously reprice the US Dollar, Treasury yields, real yields, interest-rate expectations and Gold. On FOMC day, however, simply knowing whether the Fed raises, cuts or holds rates is not enough. The market often prices the expected decision in advance, meaning the real opportunity—and risk—comes from the difference between expectations and reality, the policy statement, future-rate projections and the Fed Chair’s press conference.
The upcoming September FOMC meeting takes place on September 15–16, 2026, with the decision scheduled for 2:00 p.m. ET on September 16, followed by the press conference at 2:30 p.m. ET.
For XAU/USD, I would therefore approach FOMC as a multi-stage repricing event, not as a simple “rate hike = sell Gold” equation.
 What Is the FOMC?
The Federal Open Market Committee (FOMC) is the monetary-policy-making body of the US Federal Reserve. Among its most important responsibilities is setting the target range for the federal funds rate.
The federal funds rate influences borrowing costs throughout the US financial system. Changes in expected Fed policy therefore affect Treasury yields, mortgage and corporate borrowing rates, equity valuations, currency markets and precious metals.
For Gold traders, the transmission mechanism is particularly important:
Fed Policy → Treasury/Real Yields → USD/DXY → Gold
Gold does not pay interest. When real yields rise substantially, holding interest-bearing US assets becomes relatively more attractive, which can pressure Gold. Conversely, falling yields and a weaker dollar frequently improve the environment for Gold.
This is a relationship—not an immutable rule. Geopolitical risk, inflation fears, central-bank demand and safe-haven flows can sometimes overpower the normal rate relationship.
What Determines a Fed Rate Decision?
The Fed does not make its decision from one CPI or NFP number. It evaluates the broader economic picture.
For an XAU/USD trader, I would focus particularly on CPI/Core CPI, PCE/Core PCE, PPI, NFP, unemployment, wage growth, GDP/activity, oil and energy prices, inflation expectations and financial conditions.
Employment is particularly interesting because a strong labour market gives the Fed more room to fight inflation. Weak employment can make aggressive tightening increasingly costly.
Inflation operates in the opposite direction. Persistent inflation above the Fed’s objective strengthens the argument for tighter policy.
This makes the combination more useful than any individual indicator:
Strong NFP + Hot CPI/PPI = Hawkish Fed risk
Weak NFP + Cooling CPI/PPI = Dovish Fed risk
Strong employment + Weak inflation = Mixed
Weak employment + Hot inflation = Policy dilemma / stagflation risk
September 2026: What Are NFP, PPI and CPI Telling Us?
This particular FOMC is unusually interesting.
August payrolls increased by 162,000, versus expectations around 55,000, while unemployment remained at 4.1%. That strong employment result initially pushed market-implied September hike probability to around 60%.
Then inflation strengthened the hawkish argument.
August PPI increased 0.4% month-on-month. Following that release, the market-implied probability of a Fed increase reportedly climbed to approximately 70%. Gold reacted negatively, falling to an intraday low around $4,323.78, while the dollar and Treasury yields strengthened.
CPI subsequently increased 0.4% month-on-month and 3.4% year-on-year, while core CPI increased 0.3%.
After CPI, Reuters reported markets pricing approximately an 85% probability of a 25-basis-point hike, up from roughly 67% before the report.
There is an important distinction, however: a Reuters economist poll taken before the CPI release still showed a majority expecting the Fed to hold the 3.50%–3.75% target range.
Therefore, as of September 14, my interpretation is:
Market pricing strongly favors +25 bps, but the economist consensus has been less hawkish.
That disagreement itself creates significant FOMC volatility potential.
Rate Hike: What Does It Mean for XAU/USD?
Suppose the Fed increases rates by 25 basis points.
The textbook correlation would be:
Fed +25 bps → US yields ↑ → DXY ↑ → USDJPY potentially ↑ → XAU/USD ↓
But because the market is already heavily pricing a hike, the decision alone may not be sufficient to produce a sustained Gold crash.
If the Fed hikes exactly as expected but signals that additional hikes are unlikely, traders could interpret the package as a dovish hike. Yields could initially jump and subsequently reverse, allowing Gold to crash first and recover sharply.
The more bearish Gold scenario would therefore be:
25-bp hike + hawkish statement + higher future-rate path + Warsh signals additional tightening.
That combination could create a second repricing rather than merely confirming what the market already expects.
Fed Holds Rates: Potential Gold Reversal
A hold would now be much more interesting precisely because markets have moved toward expecting a hike.
If the Fed leaves rates unchanged and provides a sufficiently dovish explanation:
Fed Hold → Hike expectations ↓ → US yields ↓ → DXY ↓ → Gold ↑
The reaction could be disproportionately large because traders positioned for tighter policy would have to unwind those positions.
But again, the statement matters.
A hawkish hold—“no increase today, but inflation requires further tightening soon”—could produce an initial Gold rally followed by a reversal.
Therefore:
Decision ≠ complete signal.
The market trades the decision + statement + projections + press conference.
What Would a Rate Cut Mean?
A September cut currently represents the biggest dovish surprise of the three broad possibilities.
Ordinarily:
Rate Cut → yields ↓ → USD ↓ → XAU/USD ↑↑
A surprise cut could therefore produce an aggressive Gold rally.
However, traders must ask why the Fed is cutting. If an emergency cut reflected a severe financial shock, liquidity stress could initially generate abnormal cross-asset movements.
This illustrates why trading correlations is more sophisticated than mechanically buying or selling based on one headline.
My FOMC XAU/USD Correlation Dashboard
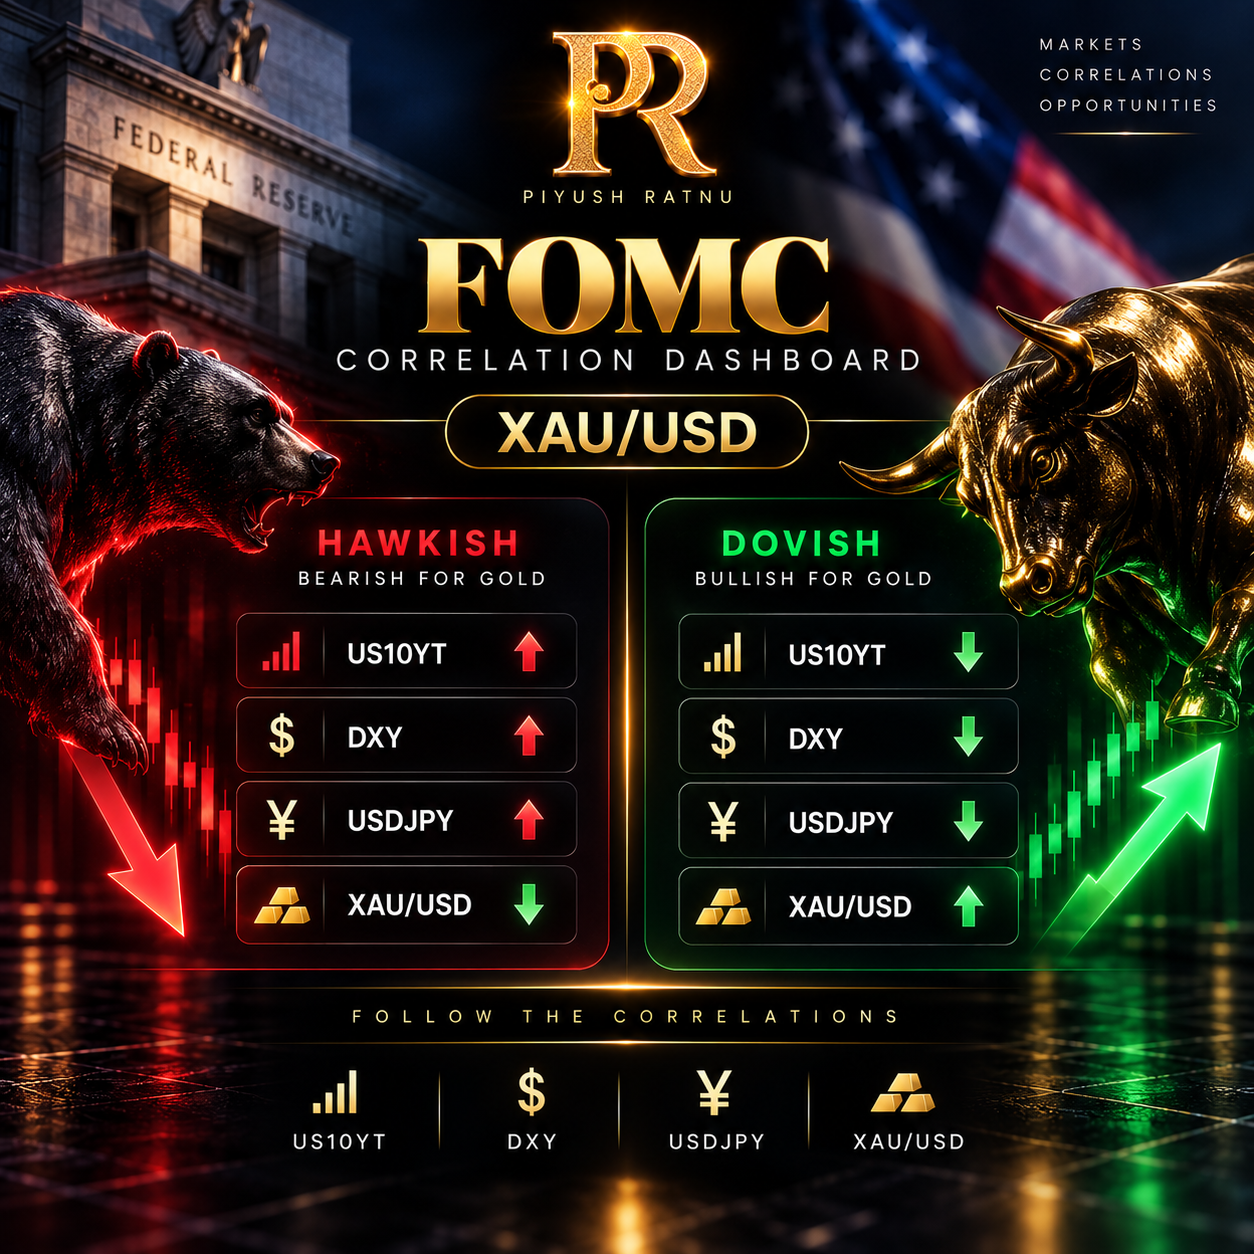
On FOMC day, I would observe US10YT, DXY and USDJPY simultaneously with XAU/USD.
My strongest bearish confirmation would be:
US10YT ↑ + DXY ↑ + USDJPY ↑ + XAU/USD ↓
That is broad cross-market confirmation of a hawkish repricing.
Conversely:
US10YT ↓ + DXY ↓ + USDJPY ↓ + XAU/USD ↑
would provide much stronger confirmation of a dovish Gold move.
The dangerous environment is when correlations disagree. For example, if the Fed hikes but DXY falls and Treasury yields reverse lower, I would not continue treating the rate hike headline itself as bearish Gold confirmation.
Trade the reaction, not merely the headline.
 The Last 12 Months: The Lesson From Fed Decisions
The most useful conclusion from the previous 12 months is not that Gold always rises or always falls after FOMC. It is that Gold trades the change in expected policy, and the repricing can begin well before the actual meeting.
This September cycle demonstrates the mechanism clearly even before FOMC. Strong payrolls increased hike expectations and pressured Gold. Hot PPI subsequently pushed the implied hike probability toward 70%, while Gold fell more than 1%.
Then CPI pushed market pricing still further toward a hike, with Reuters reporting approximately 85% odds. Yet Gold recovered about 0.8% to around $4,350 on Friday after falling nearly 2% Thursday.
That is exactly why a simplistic formula can fail:
A hawkish development can already be priced into Gold before FOMC begins.
The September decision must therefore be measured against an already-hawkish baseline.
How I Would Trade FOMC Day
My approach is not to chase the first candle.
The 2:00 p.m. ET statement can produce an algorithmic spike as rates, currencies, bonds and metals reprice simultaneously. Then, at 2:30 p.m., the press conference can completely change the interpretation.
I would divide the event into three stages.
Stage 1 — Before FOMC: Map the important XAU/USD clusters and establish what the market has already priced.
Stage 2 — Initial release: Observe the first move without assuming it represents the final direction. Watch DXY, US10YT and USDJPY.
Stage 3 — Confirmation/reversal: Determine whether cross-market correlations confirm the first Gold move, particularly as the press conference begins.
For my own buy-low framework, I would be more interested in identifying an exhaustion zone after a hawkish liquidity shock than aggressively shorting Gold after it has already fallen.
 My FOMC Price Map: $4,646 or $3,969?
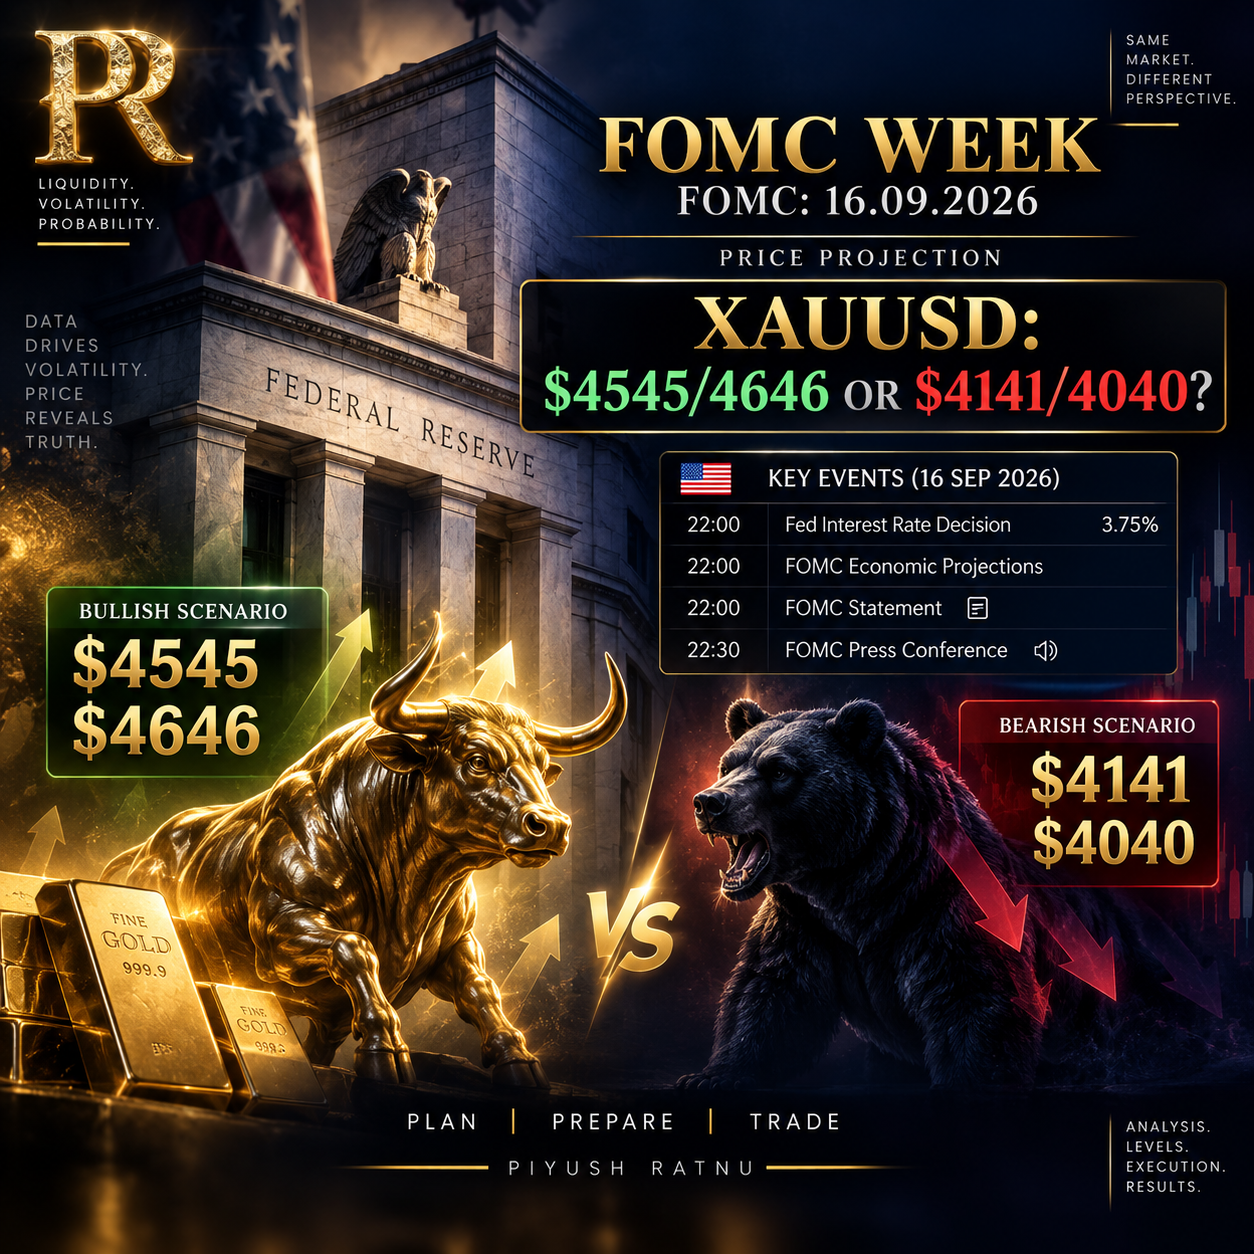
For this event, I am watching two broad scenario pathways. These are scenario levels, not guaranteed forecasts.
🔻 Hawkish FOMC / XAU/USD Crash
If the Fed hikes and delivers a significantly more hawkish outlook than currently discounted, with US10YT + DXY + USDJPY confirming, my downside cluster map is:
$4,141 → $4,040 → $3,969
The critical point is confirmation. A temporary move below support without sustained strength in yields and DXY could instead become a liquidity sweep and reversal.
🔺 Dovish FOMC / XAU/USD Rise
If the Fed unexpectedly holds, or hikes but delivers a dovish forward outlook, and Treasury yields/DXY fall, my upside map becomes:
$4,545 → $4,585 → $4,646
A clean break and acceptance above these zones would represent a very different macro repricing from a temporary FOMC spike.
Final FOMC Trading Framework
FOMC trading is not about guessing one word—HIKE, HOLD or CUT.
The better question is:
What did the market expect, what did the Fed actually deliver, and how are yields and the dollar responding?
Heading into September 16, the sequence has become increasingly hawkish: strong NFP strengthened hike expectations, PPI pushed the market further toward tightening, and CPI subsequently drove market-implied probability of a quarter-point hike to roughly 85%.
That means a 25-bp hike may no longer constitute the biggest surprise. The Fed’s forward guidance and Chairman Kevin Warsh’s press conference could matter considerably more.
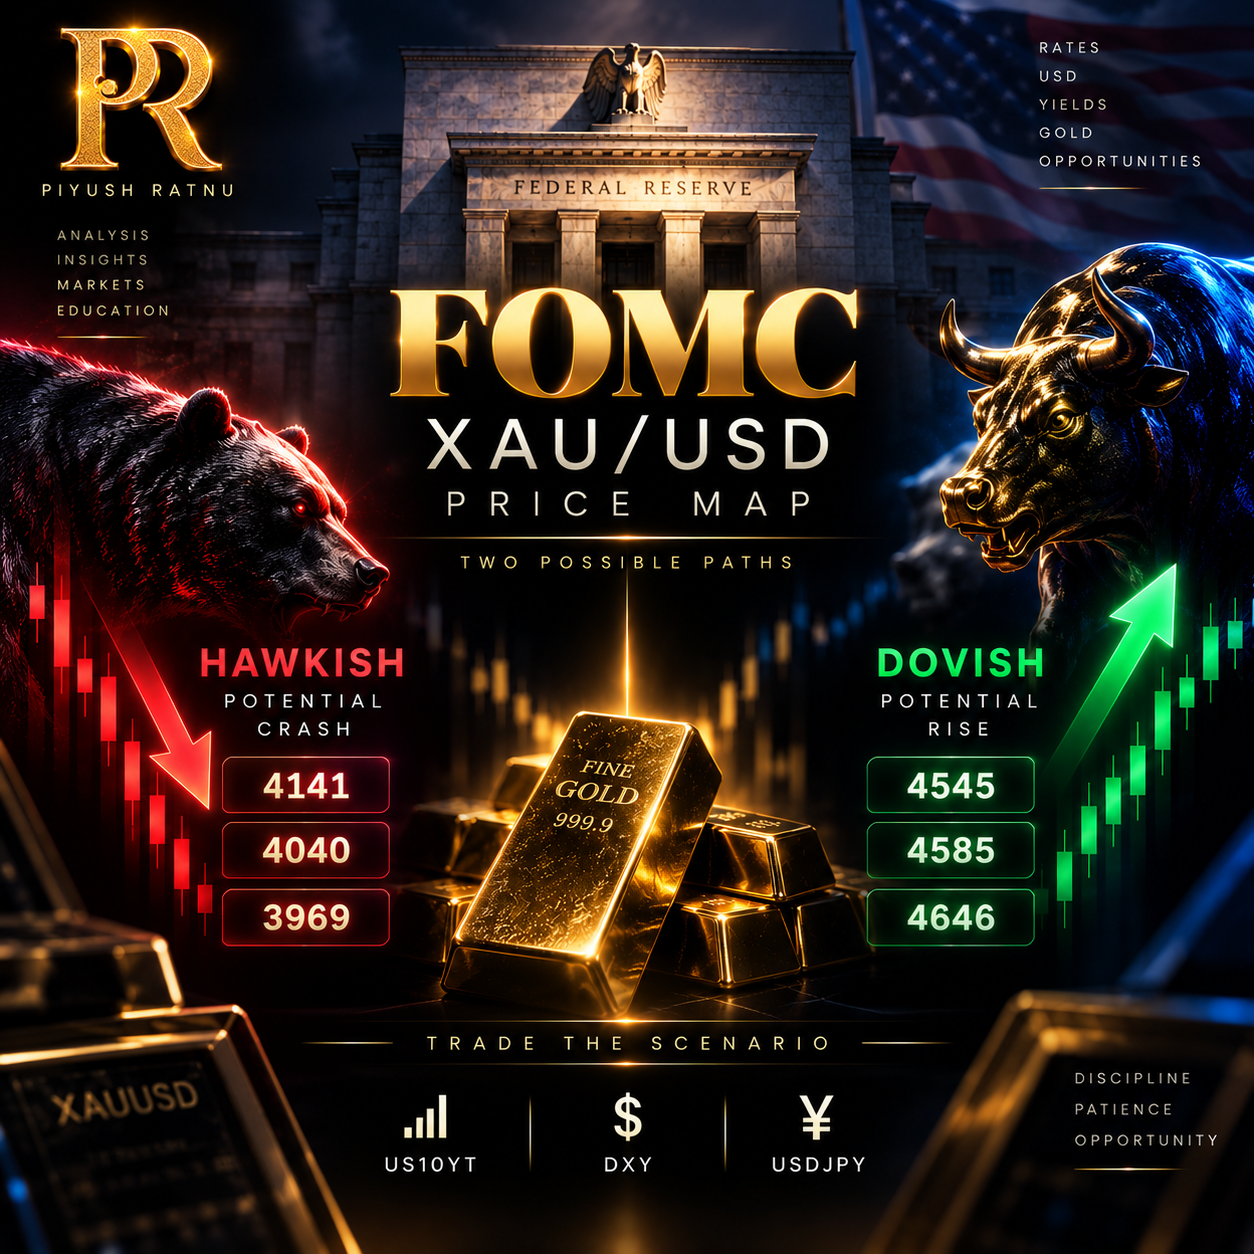 My radar therefore remains:
HAWKISH SHOCK:
$4,141 → $4,040 → $3,969
DOVISH REVERSAL:
$4,545 → $4,585 → $4,646
And above everything else:
Observe US10YT. Observe DXY. Observe USDJPY. Then observe whether XAU/USD confirms the correlations.
That is how I approach FOMC—not as a single economic announcement, but as a complete cross-market repricing event.
— Piyush Ratnu | Quant Gold Strategist
Disclaimer: The price levels above are scenario-based analytical zones, not guaranteed targets or personalized financial advice. FOMC periods can produce extreme volatility, slippage, spread expansion and rapid reversals.