How I Navigated XAU/USD’s Post-PPI Crash: From $4,400 to $4,303 and Back Toward $4,360
By Piyush Ratnu | Quant Gold Strategist
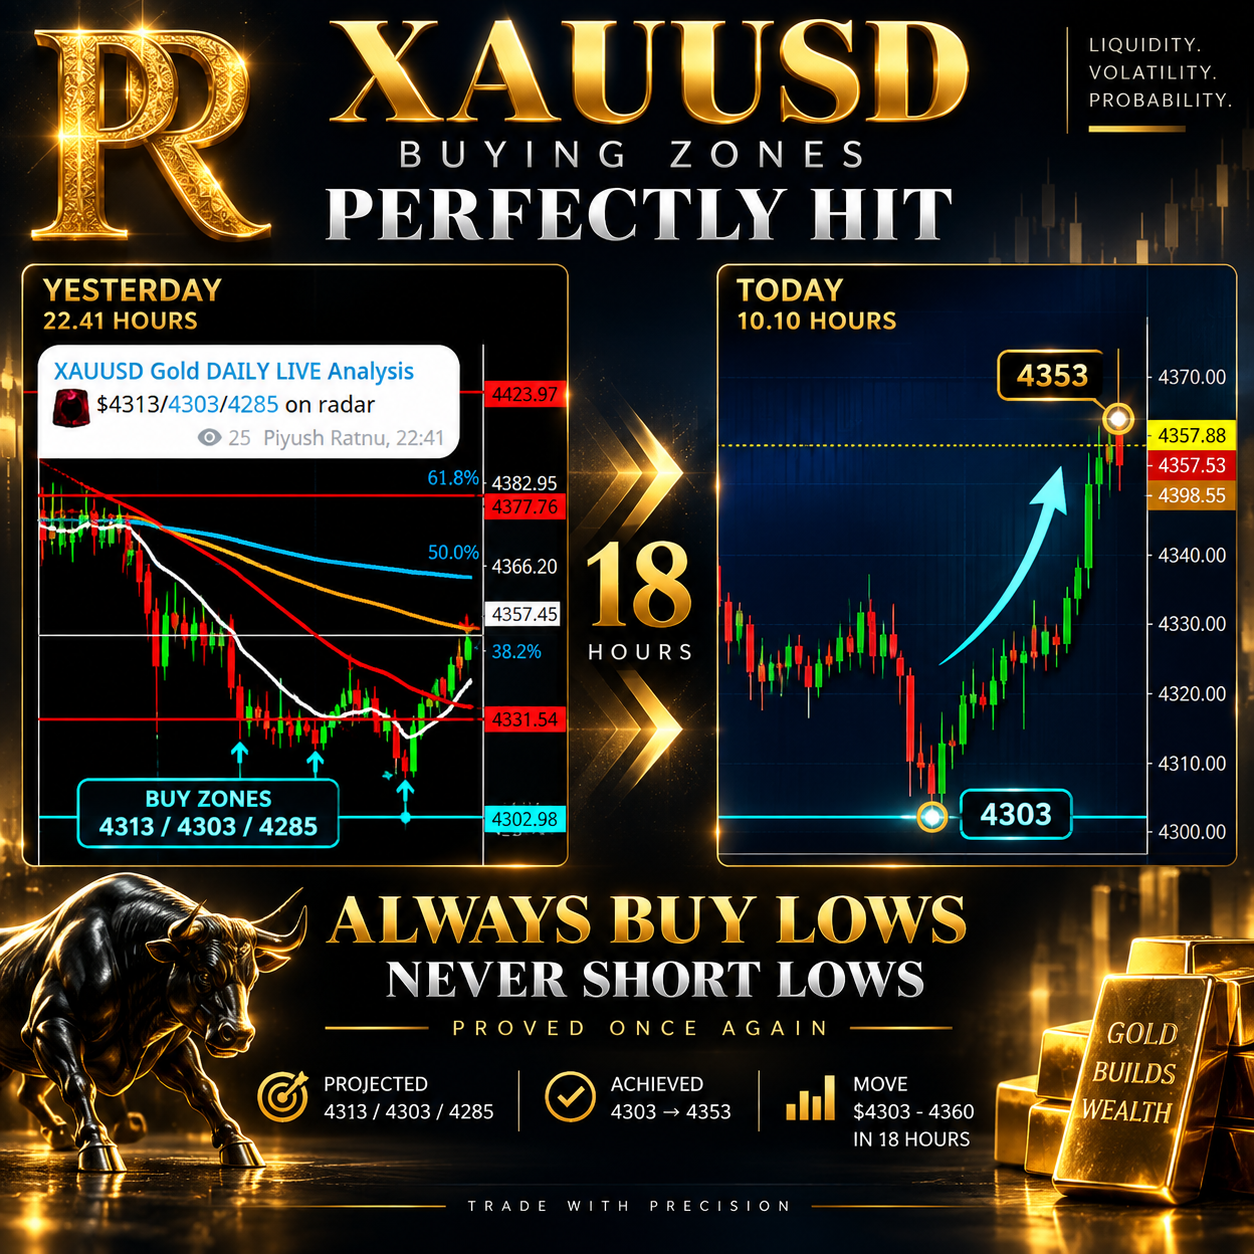
The XAU/USD price action surrounding the September 10, 2026 US Producer Price Index (PPI) was a strong example of why I focus on identifying buying zones before volatility arrives rather than reacting emotionally after a large market move. Gold moved from the $4,400 region toward $4,303, representing an approximately $97 decline, before recovering toward $4,360 this morning. From $4,303 to $4,360, that was a $57 recovery, retracing roughly 59% of the $97 decline.
What mattered to me was not simply that Gold crashed. It was that several of the downside levels I had been monitoring—$4,369, $4,343, $4,313 and $4,303—became relevant as the sell-off accelerated.
Before PPI: Gold Was Already Vulnerable
Ahead of the PPI release, XAU/USD had already shown signs of vulnerability. Gold had traded as high as approximately $4,434 during the session, but the market was dealing with an uncomfortable macro combination: rising energy prices, elevated Treasury yields and uncertainty over whether the Federal Reserve could raise rates again.
FXStreet reported before the release that Gold had reversed its earlier gains and was trading around $4,383 after reaching approximately $4,434. The market was specifically focused on whether producer inflation would reinforce expectations for tighter Federal Reserve policy.
This was exactly the type of environment in which I did not want to chase Gold higher.
My approach remained focused on BUYING LOWS.
PPI Arrived — and the Macro Environment Turned Against Gold
The official US Bureau of Labor Statistics reported that August PPI increased 0.4% month-on-month, while producer prices were 5.4% higher year-on-year. Final-demand goods prices jumped 1.1%, largely because energy prices increased 4.2%.
The significance for Gold was straightforward.
Persistent producer inflation increased concern that inflationary pressure had not disappeared. Markets subsequently raised the probability of a Federal Reserve rate increase. Reuters reported that rate-hike expectations moved to around 70% after the PPI release, compared with roughly 62% beforehand.
At the same time, the US Dollar strengthened and Treasury yields moved higher. Both are normally important headwinds for Gold because higher yields increase the opportunity cost of holding a non-yielding asset.
That combination created substantial selling pressure.
The Crash: Approximately $4,400 → $4,303
Gold’s reaction was aggressive.
Reuters recorded spot Gold falling to $4,323.78 during Thursday’s session, while another market update later showed spot Gold around $4,317.84. My trading chart subsequently recorded the deeper extension into approximately $4,303, which became the critical level in my own execution framework.
From the $4,400 reference area to $4,303, Gold had therefore lost approximately:
$4,400 − $4,303 = $97
That is a significant move for XAU/USD, particularly when it develops around a single macro repricing event.
But this is where my strategy differed from simply following the bearish momentum.
I was not interested in shorting Gold after a large fall.
I was waiting for my previously identified lower buying zones.
My Buying Map: $4,369 → $4,343 → $4,313 → $4,303
Before the lowest point was reached, my framework had already identified the sequence:
$4,369 / $4,343 / $4,313 / $4,303
Then, at 22:41 hours, I specifically highlighted $4,313 / $4,303 / $4,285 as levels on my radar.
That distinction is important. VERIFY HERE
It is easy to identify support after a chart has already bounced. The real test of an analytical framework is whether potentially important levels are identified before price reaches them.
As Gold continued falling, $4,369 and $4,343 gave way and price eventually entered the deeper $4,313–$4,303 area.
Instead of treating the accelerating decline as a reason to panic, I viewed the lower price as an increasingly interesting buying opportunity within my predefined framework.
That is the philosophy behind one of my central rules:
ALWAYS BUY LOWS. NEVER SHORT LOWS.
$4,303 Became the Turning Point
The market eventually reached approximately $4,303.
At that stage, Gold had already undergone an enormous repricing from the pre-PPI region. Selling after such an extended decline would have meant chasing momentum directly into one of my deepest projected buying zones.
I preferred the opposite approach.
Once the lower zone held and price action began confirming recovery, the asymmetric opportunity changed dramatically.
Instead of asking, “How much further can Gold crash?” my focus became:
How much of this displacement can Gold retrace?
That distinction between reacting to price and preparing for price is central to my trading methodology.
The Recovery: $4,303 → $4,360
By this morning, Gold had recovered from approximately $4,303 toward $4,360.
That represents:
$4,360 − $4,303 = $57
The $57 recovery is particularly important when measured against the preceding $97 decline.
Approximately:
$57 ÷ $97 = 58.8%
So Gold recovered roughly 59% of the $4,400-to-$4,303 decline.
The recovery also occurred despite the broader macro environment remaining difficult for bullion. Reuters reported Friday that expectations for a Fed hike remained elevated following the PPI release, while Treasury yields and the US Dollar continued to exert pressure on Gold.
That makes the technical reaction from the lower zone particularly noteworthy.
 Why the Trade Matters More Than Predicting Every Dollar
My objective is not to claim that every intermediate price fluctuation can be predicted.
My objective is to identify high-value price zones before the market reaches them, then combine those levels with macroeconomic conditions, volatility, liquidity, correlations and price confirmation.
This PPI move illustrates that process clearly.
Gold was around the $4,400 region before the major decline. Producer inflation reinforced hawkish Fed expectations. The Dollar and Treasury yields strengthened. Gold experienced intense selling pressure and ultimately extended toward my lower buying region.
Yet rather than shorting an already deeply falling market, I remained focused on the predefined buying structure.
$4,369 → $4,343 → $4,313 → $4,303.
VERIFY HERE
The market eventually reached $4,303 and subsequently recovered toward $4,360.
From Macro Shock to Buying Opportunity
The lesson I take from this episode is simple: volatility itself is not the enemy; entering without a predefined framework is.
PPI created the catalyst. Rising yields, a stronger Dollar and increasing Fed rate-hike expectations provided the macro explanation. The resulting liquidation pushed XAU/USD almost $100 lower from the $4,400 reference area.
But my trading decision was governed by price location.
The deeper Gold moved into my projected zones, the less interested I became in chasing shorts and the more closely I watched for a buying opportunity.
The eventual $4,303 → $4,360 recovery reinforced that approach.
For me, the sequence can be summarized in one line:
Projected Buying Zones: $4,369 / $4,343 / $4,313 / $4,303 → Low: ~$4,303 → Recovery: ~$4,360 → approximately $57 rebound. VERIFY HERE.
The PPI shock was substantial. The crash was substantial. But disciplined preparation around predefined levels created an opportunity within that volatility.
Know the level. Wait for confirmation. Execute without emotion.
ALWAYS BUY LOWS. NEVER SHORT LOWS.