XAU/USD September Price Cycle: Six-Year Study of Week 1–4, NFP and FOMC by Piyush Ratnu
2020–2025 Historical Analysis | By Piyush Ratnu
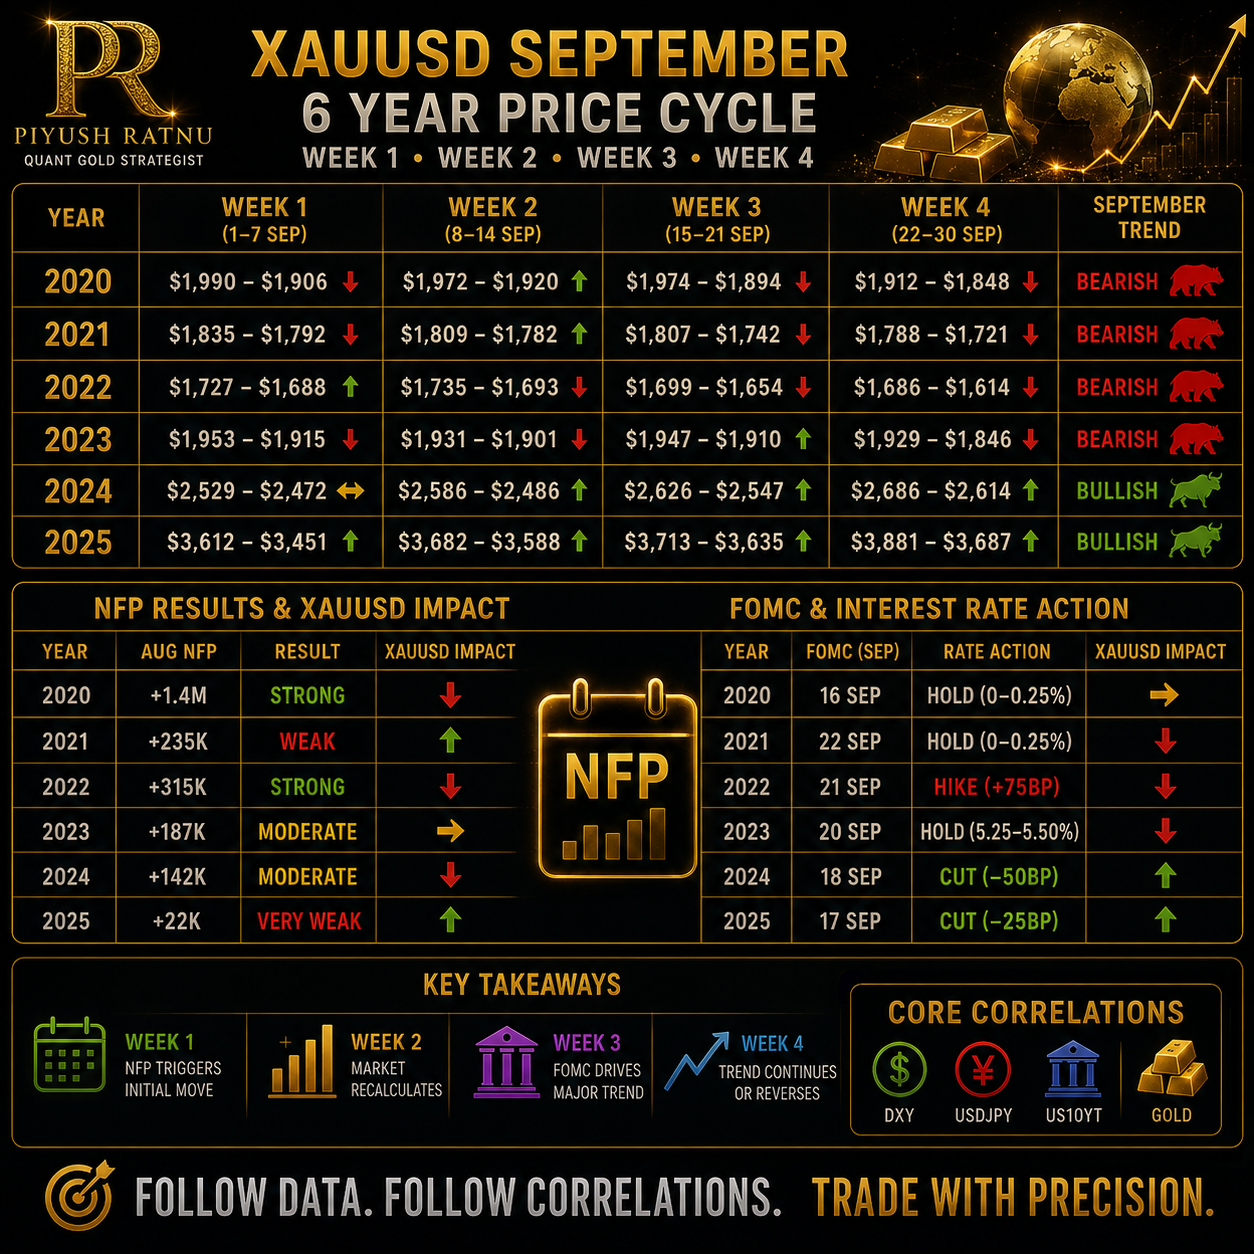
For consistency, I have treated the last six completed September months—2020 through 2025—and divided each month into Week 1: Sep 1–7, Week 2: Sep 8–14, Week 3: Sep 15–21 and Week 4: Sep 22–month-end. Prices are rounded XAU/USD high-low zones from daily historical data. This is preferable to using 2026 because September 2026 is still in progress.
Six-Year September XAU/USD Price-Action Table
| Year | Week 1: 1–7 Sep | Week 2: 8–14 Sep | Week 3: 15–21 Sep | Week 4: 22–30 Sep | September Character |
|---|---|---|---|---|---|
| 2020 | $1,990–$1,906 ↓ | $1,972–$1,920 ↑/Range | $1,974–$1,894 ↓ | $1,912–$1,848 ↓/Recovery | Broad bearish correction |
| 2021 | $1,835–$1,792 ↓ | $1,809–$1,782 ↑/Range | $1,807–$1,742 ↓ | $1,788–$1,721 ↓ | Persistent downside |
| 2022 | $1,727–$1,688 ↑/Volatile | $1,735–$1,693 ↓ | $1,699–$1,654 ↓ | $1,686–$1,614 ↓ | Aggressive Fed-driven bearish month |
| 2023 | $1,953–$1,915 ↓ | $1,931–$1,901 ↓ | $1,947–$1,910 ↑/Range | $1,929–$1,846 ↓↓↓ | Week 4 breakdown |
| 2024 | $2,529–$2,472 Range | $2,586–$2,486 ↑ | $2,626–$2,547 ↑ | $2,686–$2,614 ↑ | Powerful bullish breakout |
| 2025 | ≈$3,612–$3,451 ↑ | $3,682–$3,588 ↑ | $3,713–$3,635 ↑ | $3,881–$3,687 ↑↑ | Exceptional bullish September |
The daily XAU data show September 2020 closing down about 3.2% for the month, while 2021 fell about 3.1%, 2022 fell about 3%, and 2023 declined about 4.7%. By contrast, September 2024 gained approximately 5.3%, and September 2025 surged roughly 11.6%.
NFP + FOMC Comparison
| Year | September NFP Release* | Immediate Gold Reaction | September FOMC | XAU/USD Interpretation |
|---|---|---|---|---|
| 2020 | +1.4M, unemployment 8.4% | Volatile; Gold broadly struggled during W1 | Hold 0–0.25% | Gold subsequently weakened into W3/W4 |
| 2021 | +235K, unemployment 5.2% | Bullish Gold reaction | Hold 0–0.25%; taper signal | Gold sold heavily around W3/W4 |
| 2022 | +315K, unemployment 3.7% | Initial Gold rebound | +75 bp → 3.00–3.25% | Strong USD/yields ultimately pressured Gold |
| 2023 | +187K, unemployment 3.8% | Limited/neutral immediate response | Hold 5.25–5.50% | Hawkish-rate environment preceded W4 crash |
| 2024 | +142K, unemployment 4.2% | Initial rise reversed; Gold ended NFP day softer | −50 bp → 4.75–5.00% | Major bullish repricing followed |
| 2025 | +22K, unemployment 4.3% | Strong Gold rally / record highs | −25 bp → 4.00–4.25% | Gold accelerated higher into W4 |
*The September NFP release reports the previous month’s—August—employment data.
BLS reported August payroll increases of about 1.4 million in 2020, 235,000 in 2021, 315,000 in 2022, 187,000 in 2023, 142,000 in 2024 and only 22,000 in 2025.
What the Six-Year Pattern Tells Me About September Gold
September should not be treated simply as a bullish or bearish month. My reading of the six-year data is that it is better understood as a macro-repricing month, with the first NFP release establishing an important labour-market signal and the mid-month FOMC decision frequently creating the larger second-stage move.
 Week 1: NFP Creates the First Volatility Window
Week 1 repeatedly contains the U.S. employment report. The important point is that Gold does not react only to the headline payroll number.
It reprices the combination of:
NFP → Unemployment → Wages → Fed expectations → US Treasury yields → DXY → XAU/USD.
This explains why apparently similar NFP outcomes can create very different Gold reactions.
In September 2021, payroll growth of just 235,000 was dramatically weaker than economists had expected, encouraging a drop in the dollar and pushing Gold higher after the announcement. Reuters reported Gold gaining as the jobs miss reduced pressure for rapid Fed tapering.
September 2025 provides an even clearer example. Payrolls increased just 22,000, unemployment reached 4.3%, Treasury yields and the dollar fell, and expectations for a Fed cut increased sharply. Gold surged toward $3,600 and fresh records.
Thus:
Weak NFP → yields ↓ → DXY ↓ → rate-cut probability ↑ → XAU/USD ↑
is generally the bullish Gold mechanism.
But it is a relationship, not an automatic rule.
Week 2: The Market Recalculates the FOMC
Week 2 appears to function frequently as a transition or positioning period.
After the initial NFP reaction, markets reassess inflation, yields, Fed expectations and positioning ahead of the FOMC.
This is visible particularly in 2020–2023, when Week 2 often produced smaller ranges or temporary rebounds before a larger directional move appeared later.
For trading analysis, this makes Week 2 important because a recovery following an NFP decline should not automatically be interpreted as a new monthly bullish trend.
The bond market remains crucial.
US10Y ↑ + real yields ↑ + DXY ↑ = generally negative for Gold.
Conversely:
US10Y ↓ + real yields ↓ + DXY ↓ = generally supportive for Gold.
Week 3: FOMC Becomes the Major Catalyst
The third week is arguably the most important structural period because most of these September FOMC meetings occurred around September 16–22.
The regime difference is striking.
In September 2022, the Federal Reserve raised rates another 75 basis points, taking the target range to 3.00–3.25%.
Gold ultimately remained under heavy pressure and moved toward the $1,600s.
In September 2023, the Fed held at 5.25–5.50%, but maintained a restrictive stance.
The much more dramatic reversal occurred in September 2024, when the Federal Reserve cut rates by 50 basis points to 4.75–5.00%.
Gold subsequently advanced through approximately $2,600 and $2,680, transforming September from the bearish patterns seen in 2020–2023 into a powerful bullish month.
Week 4: Where the Larger Trend Often Reveals Itself
Week 4 produced some of the most important extensions in the six-year sample.
In 2020 Gold fell into approximately $1,848. In 2022 it reached roughly $1,614. September 2023 produced a dramatic decline toward $1,846.
The opposite happened after the monetary-policy regime turned toward easing.
September 2024 reached approximately $2,686, while September 2025 accelerated toward $3,881.
That gives us an important historical distinction:
2020–2023: September predominantly bearish.
2024–2025: September strongly bullish.
The difference was not seasonality alone. Monetary policy changed.
The Interest-Rate Lesson for XAU/USD
Across these six Septembers, the clearest macro relationship is:
Rate hikes / higher-for-longer expectations
→ Treasury yields ↑
→ USD supported
→ Gold opportunity cost ↑
→ XAU/USD pressure
while:
Rate cuts / increasing cut expectations
→ Treasury yields ↓
→ USD pressure
→ Gold opportunity cost ↓
→ XAU/USD support
The Fed held rates near zero in both September 2020 and September 2021. It delivered a 75-bp hike in 2022, held at restrictive 5.25–5.50% in 2023, delivered a 50-bp cut in 2024, and another 25-bp cut in September 2025.
Conclusion — My September XAU/USD Framework
The last six completed September cycles demonstrate why I do not view NFP or FOMC in isolation.
The sequence I focus on is:
NFP → US10Y → DXY → USD/JPY → FOMC expectations → XAU/USD
Week 1 establishes the first employment-driven repricing. Week 2 frequently becomes a consolidation or positioning phase. Week 3 brings the FOMC and potentially the largest policy shock. Week 4 then often delivers the clearest continuation or reversal of the macro trend.
The historical evidence also shows why blindly assuming that Gold always rises after weak NFP or after a rate cut can be dangerous. The expectation before the event, Fed guidance, Treasury yields, DXY and positioning determine the actual reaction.
For XAU/USD, the better approach is therefore to combine historical price cycles, specific price zones and real-time macro correlations rather than depending on any single economic headline.
Piyush Ratnu | Quant Gold Strategist
Strategy. Precision. Performance.
Historical market behaviour does not guarantee that future September price action will follow the same pattern.