XAU/USD Summary Since Friday (NFP Release)
Friday (NFP Day)
- Gold collapsed from the 4470–4480 region after stronger-than-expected U.S. Non-Farm Payroll data.
- Strong employment numbers reinforced expectations that the Federal Reserve will remain focused on inflation rather than rate cuts.
- The U.S. Dollar strengthened and Treasury yields moved higher.
- XAU/USD fell sharply and tested 4268, creating the lowest level seen since late March.
Weekend Developments
- Markets focused on the Iran-Israel conflict and U.S.-Iran diplomatic discussions.
- Initial fears of wider regional escalation kept safe-haven demand alive.
- However, reports suggesting a temporary halt in direct attacks reduced panic buying in gold.
Monday
- Gold staged a recovery from 4268 and rebounded toward the 4330–4340 area.
- The U.S. Dollar eased from recent highs.
- Equities rallied as traders became more optimistic about a possible de-escalation in the Middle East.
- Despite the rebound, gold failed to reclaim the important 4408 (38.2% Fibonacci) zone.
Tuesday (Current Structure)
- Price remains trapped around 4336–4343.
- Buyers are defending the 50% retracement area.
- Sellers continue to dominate below 4408–4444.
- Market participants are waiting for:
- U.S. CPI
- U.S. PPI
- Further Iran-Israel headlines
- Fed policy expectations
Key Price Action Since Friday
| Event | Price |
|---|---|
| NFP Sell-Off High | ~4477 |
| NFP Crash Low | ~4268 |
| Recovery High | ~4340 |
| Current Zone | 4336–4343 |
Net Move Since Friday High: approximately -140 to -150 dollars
PR Technical Outlook
Bullish Recovery Scenario
If 4343 holds and inflation data comes softer:
- 4408
- 4444
- 4545
Bearish Continuation Scenario
If CPI surprises higher and yields rise:
- 4300
- 4242
- 4200
One-Line Summary
Since Friday’s NFP release, XAU/USD has experienced a sharp $200+ intraday liquidation from the 4470s to 4268, followed by a weak recovery toward 4340, with the market currently consolidating below major resistance at 4408 while awaiting U.S. inflation data and further Middle East developments.
 1. Market Structure
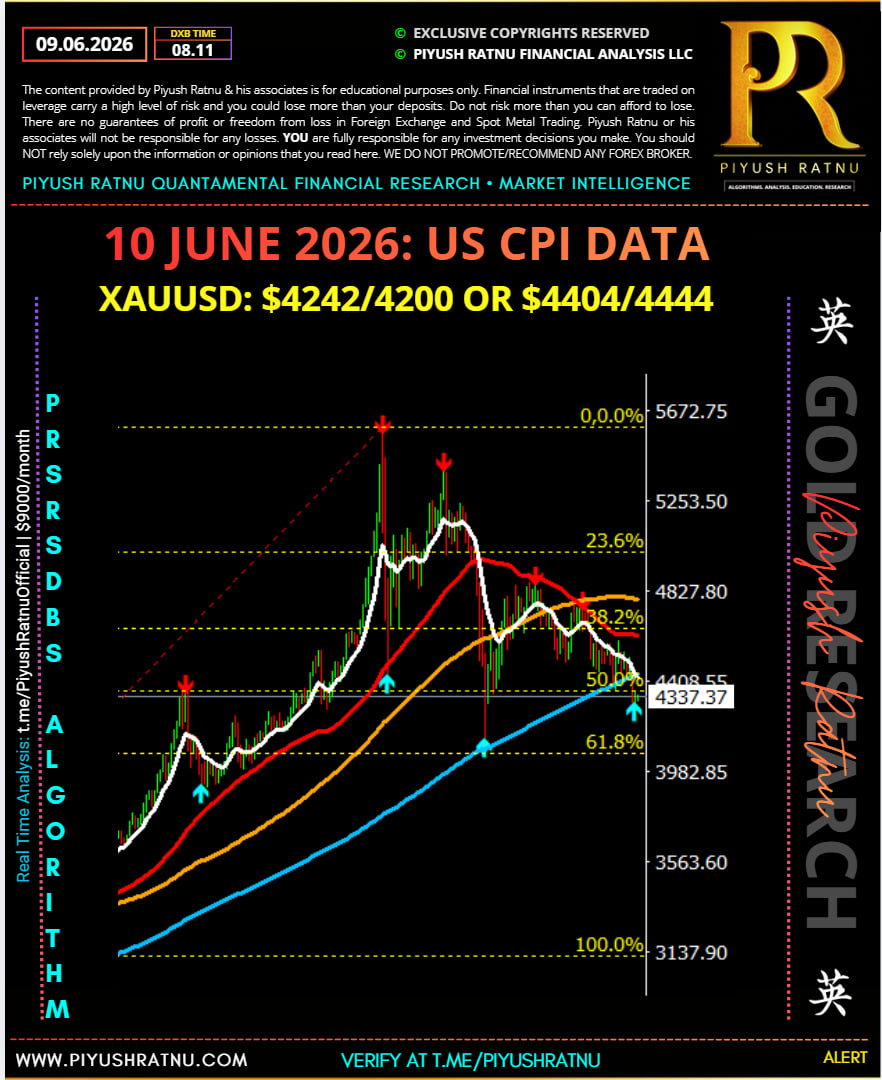
The chart shows a major impulsive rally from approximately 3138 to 5673, followed by a prolonged corrective phase.
- Swing High: 5672.75
- Swing Low: 3137.90
- Current Price Area: 4336–4408
- Price has retraced almost exactly to the 50% Fibonacci retracement level (4408.55).
- The market is currently attempting to hold above the rising long-term trendline (blue MA/trend support).
2. Fibonacci Analysis
The key Fibonacci levels visible are:
| Level | Price |
|---|---|
| 23.6% | 4827.80 |
| 38.2% | 4408.55 |
| 50.0% | ~4408 |
| 61.8% | 3982.85 |
Important Observation
Price has already:
- Broken below 23.6%
- Rejected 38.2%
- Reached the 50% retracement zone
The current battle is occurring around one of the most important institutional levels on the chart.
3. Moving Average Analysis
The chart contains:
- Red MA (short-medium term)
- Orange MA (medium term)
- Blue MA (long-term trend)
Current structure:
❌ Price below Red MA
❌ Price below Orange MA
✅ Price still above Blue MA
This indicates:
- Short-term trend = Bearish
- Medium-term trend = Bearish
- Long-term trend = Bullish but weakening
4. Support Zones
Immediate Support
- 4336
- 4300 psychological level
Major Support
- 4242
- 4200
Critical Support
- 3983 (61.8% Fib)
A break below 4242 would significantly increase the probability of a move toward 4200 and eventually 3983.
5. Resistance Zones
Near-Term Resistance
- 4408
- 4444
Major Resistance
- 4545
- 4646
Trend Reversal Zone
- 4828
Only a sustained recovery above 4828 would restore a strong bullish structure.
6. Probability Assessment
Bullish Scenario (40%)
If:
- CPI/PPI softer than expected
- USD weakens
- Geopolitical tensions increase
Then:
4336 → 4408 → 4444 → 4545
could unfold.
Bearish Scenario (60%)
If:
- CPI remains elevated
- Fed stays hawkish
- Risk sentiment improves
Then:
4336 → 4300 → 4242 → 4200
becomes the higher probability path.
7. PR Cluster Outlook
Based on the structure shown:
| Level | Significance |
|---|---|
| 4444 | First recovery target |
| 4408 | Current battle zone |
| 4343 | Immediate support |
| 4242 | Major buying zone |
| 4200 | Extreme support |
| 3983 | 61.8% retracement |
Conclusion
The chart remains in a medium-term corrective downtrend after the rejection from the 5673 peak. The 4408–4343 zone is currently acting as a critical decision point. As long as price remains below 4444–4545, rallies are likely to face selling pressure.
The most important level on this chart is 4242. A weekly close below 4242 would open the door toward 4200–3983, while holding above 4242 could trigger a recovery back toward 4444–4545.
Current Bias: Neutral to Bearish
Key Level: 4242
Risk Zone: Below 4200
Recovery Trigger: Above 4444
Trend Reversal Confirmation: Above 4828.