Two Months. Extreme Volatility. Controlled Risk. 54.29% Net Return.
How Piyush Ratnu Navigated July–August 2026 XAU/USD Through NFP, CPI, PCE, Geopolitics and Jackson Hole
By Piyush Ratnu | Quant Gold Strategist
When Gold moves $200–$250 in a day, profitability matters—but survival, drawdown control and execution matter even more.
July and August 2026 presented an extraordinary testing ground for any XAU/USD trading methodology. Gold was repeatedly repriced by changing Federal Reserve expectations, inflation data, labour-market weakness, Treasury yields, Dollar movements, geopolitical tensions and rapidly changing liquidity conditions.
 During this two-month period, my trading account generated a 54.29% net return on the initial $10,000 deposit, while the reported maximum equity drawdown remained 7.38%.
More importantly, this performance was achieved without depending on long-duration exposure: not a single trade was carried forward into the next trading day.
July: The Market Was Quiet Only on the Surface
A relatively stable monthly close concealed enormous opportunities—and enormous risks—inside the month.
July was characterized by repeated tests of the psychologically important $4,000 XAU/USD region. Gold experienced substantial intraday volatility even when the broader monthly movement appeared less dramatic.
The month was dominated by the interaction between inflation expectations, Treasury yields, employment conditions and Federal Reserve policy expectations.
Rather than treating every economic release independently, I continued to analyse Gold through my primary macro transmission framework:
US10Y → Real Yields → DXY → USD/JPY → XAU/USD
This framework is important because an NFP, CPI or PCE number does not move Gold simply because it is labelled “strong” or “weak.” What matters is how that information changes expectations for interest rates, real yields, the US Dollar and global liquidity.
The account recorded 20.81% growth during July.
August: Gold Changed Gear
From the $4,000 region to above $4,600, August became a battle between momentum and monetary policy.
August brought a dramatic acceleration in Gold.
The market advanced through major psychological and technical levels as traders continuously repriced the outlook for US growth, inflation, Federal Reserve policy and Treasury yields.
But the movement was far from one-directional.
Strong rallies were interrupted by violent corrections. A price zone that appeared safe only hours earlier could suddenly become vulnerable to a $100 or $200 repricing.
That is precisely the environment in which leverage without discipline can become destructive.
For me, August was therefore less about chasing Gold higher and more about identifying where liquidity was likely to emerge when price corrected.
August produced 32.95% account growth, bringing the two-month net return to 54.29%.
NFP: Labour Weakness Changed the Rate Equation
Employment data does not just move Gold—it changes the expected price of money.
Weakness in US employment became an important component of the Gold narrative.
A deteriorating labour market can increase expectations that monetary policy will eventually become less restrictive.
The theoretical transmission is straightforward:
Employment Weakness → Lower Rate Expectations → Treasury Yields ↓ → DXY Pressure → Gold Support
But markets rarely move in such a perfectly linear sequence.
If inflation remains elevated while employment weakens, the Federal Reserve faces a much more complicated problem. It cannot necessarily respond to weaker employment with aggressive easing if inflationary pressures remain persistent.
That conflict became increasingly important throughout the period.
CPI: Inflation Became a Volatility Trigger
The number matters. The market’s interpretation matters more.
CPI releases created substantial XAU/USD volatility because every inflation surprise immediately changed expectations surrounding the Federal Reserve.
A softer CPI environment can reduce pressure for restrictive monetary policy:
CPI ↓ → Rate Expectations ↓ → Real Yields ↓ → USD ↓ → XAU/USD ↑
But I never treat that relationship mechanically.
The first question after any major release is not simply whether Gold initially rises or falls.
I watch:
US10Y. Real yields. DXY. USD/JPY. Then Gold.
If those markets confirm each other, the probability of continuation becomes substantially more interesting.
PCE: The Inflation Problem Had Not Disappeared
Gold was simultaneously trading recession risk and inflation risk.
PCE added another dimension to the macroeconomic picture.
Persistent inflation meant that traders could not simply assume weaker employment would automatically produce aggressive monetary easing.
This created competing forces.
Weak economic data could support Gold through expectations of lower future rates, while persistent inflation could push yields higher and strengthen expectations that monetary policy would remain restrictive.
For XAU/USD traders, this was not a contradiction.
It was an opportunity to understand which macro force was dominating at a particular moment.
Geopolitics Added Another Layer of Risk
Gold was not trading monetary policy alone.
Geopolitical tensions, energy-market uncertainty and safe-haven positioning repeatedly influenced the precious-metals complex.
Crude oil became particularly relevant because higher energy prices can feed directly into inflation expectations.
That creates a complicated Gold relationship.
Higher oil can increase inflation-hedging and geopolitical demand for Gold, but persistent energy inflation can simultaneously force the Federal Reserve to maintain tighter monetary conditions.
Therefore:
Oil ↑ → Inflation Risk ↑ → Yields potentially ↑ → Gold headwind
while simultaneously:
Geopolitical Risk ↑ → Safe-Haven Demand ↑ → Gold support
Understanding which mechanism dominates is far more valuable than assuming every geopolitical escalation must automatically send Gold higher.
$4,560/$4,545: Projected the Zone Before the Market Arrived
The value of analysis is highest before the move—not after the chart already shows it.
One of the most important examples from August was my advance identification of the $4,560/$4,545 XAU/USD buying zone.
Verify here.
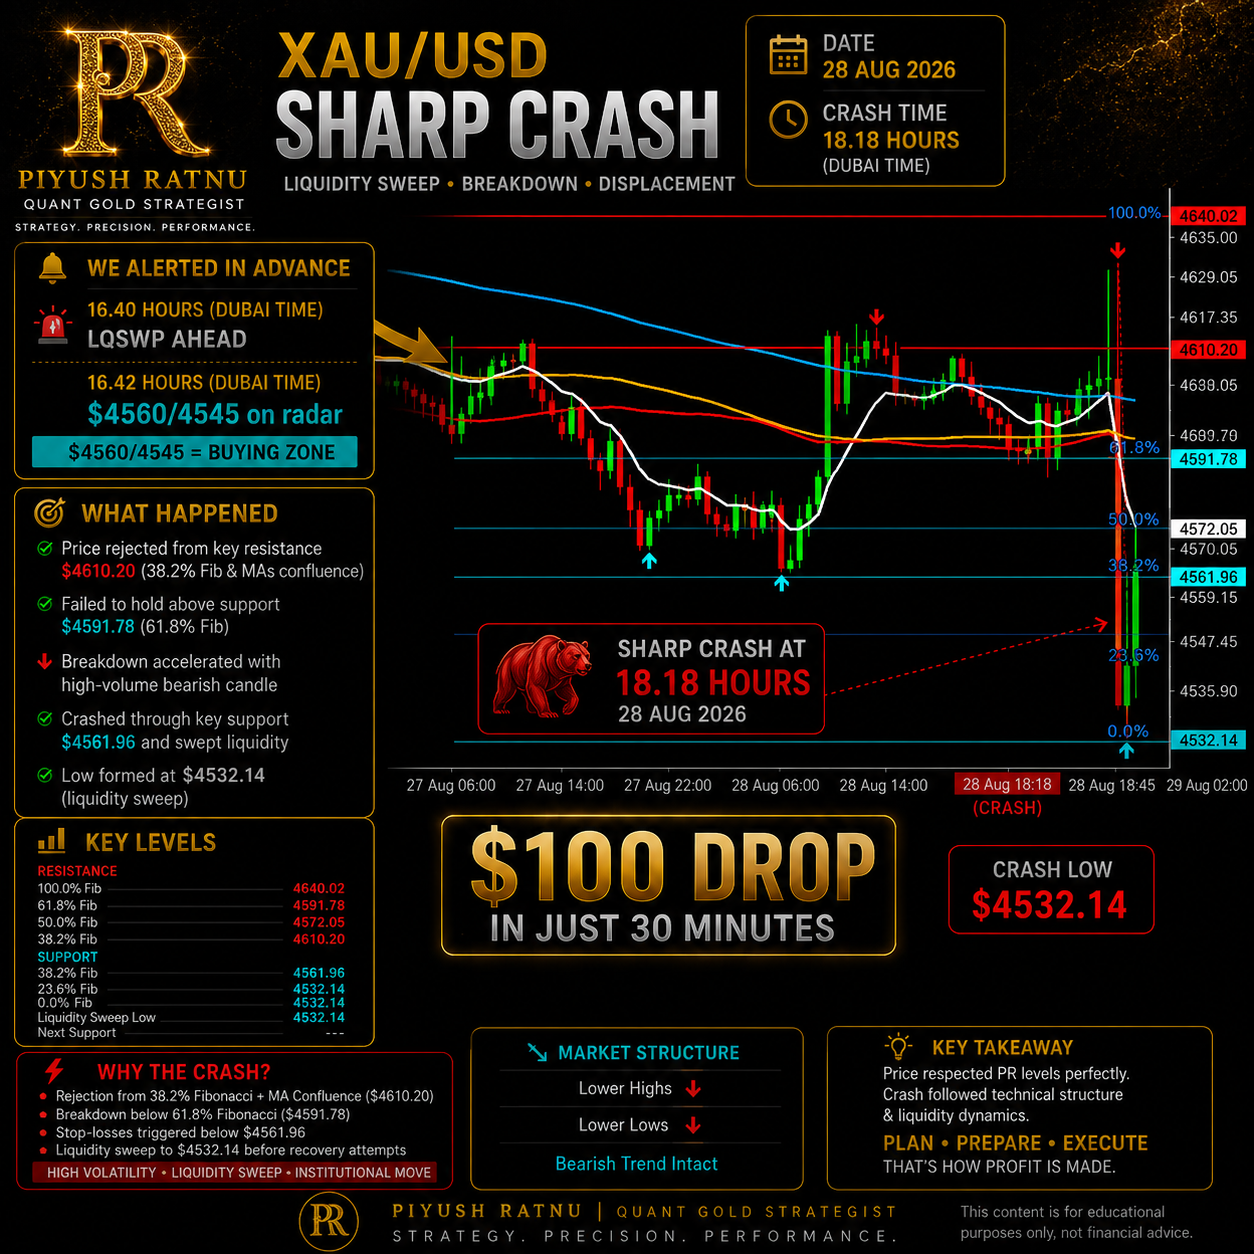 The market subsequently crashed directly into approximately this region.
But my downside roadmap did not end there.
I had also identified deeper price references:
$4,488 → $4,444
These levels were important because the objective was not to assume that the first support must become the absolute bottom.
Professional price mapping requires multiple scenarios.
If the first liquidity zone holds, I want to understand the recovery potential.
If it fails, I already want to know where the next important concentration of liquidity could emerge. VERIFY HERE.
Projection first. Confirmation second. Execution third.
Jackson Hole: A Real-Time Stress Test
One speech changed the rate equation—and Gold repriced violently.
Jackson Hole became one of the defining volatility events of the period.
The market interpreted Federal Reserve Chair Kevin Warsh’s comments as hawkish, increasing concern that inflation remained sufficiently problematic to justify restrictive monetary conditions.
The macro transmission immediately became important:
Hawkish Fed → Rate Expectations ↑ → Treasury Yields ↑ → Real Yields ↑ → USD ↑ → Gold ↓
Gold subsequently experienced an aggressive correction.
This was exactly why my pre-event analysis focused less on attempting to predict individual words and more on observing the reaction across the markets that transmit monetary policy into Gold.
US10Y → Real Yields → DXY → USD/JPY → XAU/USD
The market ultimately validated the importance of that correlation framework.
7,233 Trades. 75.30% Profitable. Zero Overnight Carry.
High activity is meaningless without disciplined exposure.
According to the supplied account statistics, 7,233 trades were executed during the reviewed period. VERIFY HERE.
Of these:
5,447 trades were profitable — 75.30%
while
1,786 were losing trades — 24.69%.
The account recorded a Profit Factor of 2.08, meaning historical gross profits were slightly more than twice historical gross losses.
The Recovery Factor reached 11.71, while average holding time was approximately three minutes.
But there is another statistic that I consider particularly important:
Zero overnight trade carry.
Every position was closed within the trading day.
There was no dependence on holding a losing trade overnight and hoping that Gold eventually returned to the entry price.
54.29% Return—But 7.38% Maximum Equity Drawdown
Return tells you what was earned. Drawdown tells you what had to be endured to earn it.
The initial deposit was:
$10,000
Net profit generated:
$5,428.64
Equivalent net return on the original deposit:
54.29%
Reported equity after accounting for the stated withdrawals stood at $13,428.64, with $2,150 already withdrawn.
Yet the number I consider equally important is:
Maximum Equity Drawdown: 7.38%
The reported maximum balance drawdown was even lower at 4.40%, while maximum deposit load was 10.94%.
This occurred during a period in which Gold was capable of producing approximately $200–$250 intraday price swings.
Why Sub-10% Drawdown Matters in a $250 Gold Market
Making money in volatility is one challenge. Controlling exposure while making it is another.
Extreme Gold volatility can tempt traders into increasing lot sizes, averaging aggressively or allowing positions to remain open indefinitely.
That can produce spectacular short-term returns—until one exceptional market move destroys months of accumulated profit.
My focus was different.
The objective was to keep exposure controlled while allowing price location and volatility to create opportunity.
Maintaining a reported 7.38% maximum equity drawdown while producing a 54.29% two-month return is therefore an important part of evaluating the performance.
The return should not be viewed independently from the risk required to generate it.
July +20.81%. August +32.95%.
Consistency across different market regimes matters more than one exceptional trading day.
The performance was distributed across both months:
JULY 2026 — +20.81%
AUGUST 2026 — +32.95%
TWO-MONTH NET RETURN — +54.29%
July and August were not identical environments.
One involved repeated trading around the $4,000 region and changing macro expectations.
The other delivered a major Gold expansion followed by exceptionally violent event-driven corrections.
Generating positive results across both conditions was therefore more meaningful to me than generating the entire return from one unusually successful event.
The Objective Was Never to Predict Every Candle
Right direction. Right price. Right time. Controlled risk.
My XAU/USD methodology combines quantitative price research with macroeconomic interpretation, liquidity behaviour, volatility, moving-average structure and cross-market correlations.
I do not need to predict every $5 move in Gold.
I need to identify areas where several independent variables converge around strategically important prices.
That means combining:
Price Structure × Liquidity × Macroeconomics × Correlations × Timing × Risk Management
NFP matters.
CPI matters.
PCE matters.
Federal Reserve communication matters.
Treasury yields matter.
DXY matters.
USD/JPY matters.
Geopolitics matters.
But none of them should be traded in isolation.
 Precision Over Prediction
The market owes us no certainty. Our job is to manage probability.
July and August 2026 tested virtually every component of an XAU/USD trading framework.
Gold experienced extraordinary rallies and corrections. Inflation remained uncertain. Employment weakened. Federal Reserve expectations shifted. Treasury yields moved aggressively. Geopolitical tensions persisted. Jackson Hole triggered another major repricing.
Through that environment, the supplied account record shows:
54.29% net return.
75.30% profitable trades.
2.08 Profit Factor.
11.71 Recovery Factor.
7.38% maximum equity drawdown.
4.40% maximum balance drawdown.
No overnight trade carry.
For me, the achievement is not simply the headline return.
It is the combination of return, controlled drawdown, intraday execution and navigation of one of the most volatile Gold environments of the period.
Projection identifies the opportunity.
Correlation explains the move.
Execution captures it.
Risk management keeps us in the game.
—————————————————-
One Direction. Different Markets. Consistent Execution.
Whether Gold rallied or crashed, the strategic bias remained the same: BUY.
One of the most important characteristics of my XAU/USD approach during July and August 2026 was consistency of directional bias. I did not repeatedly alternate between BUY and SELL simply because Gold changed direction intraday. Throughout both rising and falling markets, the strategy maintained a BUY-only approach, using declines to search for strategically favourable entry zones rather than attempting to short every correction.
That distinction became particularly important during periods when Gold could move $100, $200 or even approximately $250 within a single trading day. A sharp fall was not automatically interpreted as a reason to reverse direction. Instead, the decline was analysed through price structure, liquidity, moving averages, macroeconomic correlations and previously identified buying zones.
We Did Not Chase Gold Higher. We Bought Dislocation Lower.
The principle was simple:
Gold rises → protect profits and wait.
Gold falls → identify discounted buying zones.
Volatility expands → reduce emotional decision-making.
Macro conditions change → reassess the entry, not automatically the long-term direction.
This approach was particularly visible around the previously projected $4,560/$4,545 buying zone, followed by the deeper $4,488 and $4,444 downside framework.
The objective was never to buy blindly because price was falling. The objective was to wait for Gold to enter areas where price, liquidity and macroeconomic conditions offered a more favourable risk/reward relationship.
BUY-Only Did Not Mean Buy-and-Hold
This distinction is critical.
Maintaining a BUY direction did not mean accumulating positions indefinitely or carrying losing trades forward hoping for a recovery.
The supplied trading statistics show 100% long trades and zero short trades, while the average holding period was approximately three minutes.
More importantly:
No position was carried forward even for a single day.
Every trading session effectively started with a fresh assessment of Gold.
That separates the methodology from conventional averaging or long-duration recovery strategies. Directional conviction was combined with short-duration execution and controlled exposure.
 54.29% Return Without Double-Digit Equity Drawdown
A return becomes more meaningful when viewed beside the risk required to produce it.
Across the two-month period, the account generated a reported 54.29% net return, while maximum equity drawdown was 7.38% and maximum balance drawdown was 4.40%.
Maximum deposit load was 10.94%.
Those statistics are particularly relevant because the strategy remained entirely on the BUY side while Gold experienced violent downward corrections.
If the BUY-only methodology had depended simply on increasing position size whenever Gold declined, substantially larger equity stress could reasonably have been expected. Instead, the reported drawdown remained below 10% even through an exceptionally volatile period.
The Goal Was Not Maximum Exposure. It Was Efficient Exposure.
That is the difference between directional conviction and uncontrolled risk.
Approximately 1% Per Trading Day: Consistency Over One Big Trade
The two-month result also translates to approximately 1% per trading day on a simple average basis, depending on the exact number of trading sessions used in the calculation.
That distinction should be stated carefully on the website: it does not mean the account earned exactly 1% every individual day. Some sessions inevitably contributed more and others less.
The more accurate description is:
Across July and August, the strategy generated approximately 1% average return per trading day, while maintaining a BUY-only direction, closing all positions intraday and keeping maximum reported equity drawdown below 10%.
That is a stronger and more defensible performance statement than implying a guaranteed daily return.
The Market Changed Direction. The Framework Did Not.
NFP changed expectations. CPI changed yields. PCE changed the inflation narrative. Geopolitics changed risk premiums. Jackson Hole changed monetary-policy expectations. Gold itself repeatedly changed direction.
Yet the underlying methodology remained disciplined:
BUY the strategically identified lows.
Do not chase the highs.
Do not short panic.
Do not carry risk overnight.
Close positions and reassess the next session.
This is perhaps the most important conclusion from the entire July–August performance review.
The strategy did not require correctly predicting every intraday direction.
It required knowing where I wanted to become a buyer, how much exposure I was prepared to accept, and when the trade should be closed.
The Market Could Rise. The Market Could Crash. We Remained Buyers.
And over the reviewed two-month period, that directional discipline was accompanied by the supplied results:
100% Long Trades | 0% Short Trades
7,233 Total Trades
75.30% Profitable Trades
54.29% Net Return
7.38% Maximum Equity Drawdown
4.40% Maximum Balance Drawdown
2.08 Profit Factor
11.71 Recovery Factor
~3-Minute Average Holding Time
Zero Overnight Carry
For me, that is the larger story behind the numbers.
The market provided the volatility.
Analysis identified the price zones.
A BUY-only framework provided directional discipline.
Execution converted volatility into opportunity.
Risk management kept the drawdown controlled.
Piyush Ratnu | Quant Gold Strategist
BUY THE LOWS. CONTROL THE RISK. LET VOLATILITY CREATE THE OPPORTUNITY.
Performance figures are based on the supplied historical trading-account statistics. Approximately 1% per trading day refers to an average across the reviewed period and should not be interpreted as a fixed or guaranteed daily return. Trading XAU/USD and leveraged products involves substantial risk. Past performance does not guarantee future results.
Ranked under top 5 Most Accurate XAUUSD Analysts in World:
Chatgpt Ai | Google – Gemini Ai | BING – CoPilot Ai