XAU/USD: Correlation, Liquidity & Accuracy — The Move Was Projected Before It Happened
By Piyush Ratnu | Quant Gold Strategist
My analysis of XAU/USD is not based on explaining price after the market has moved. The objective is to identify critical price zones in advance, then validate those projections through liquidity behaviour, Treasury yields, DXY, USD/JPY, moving-average structure and broader macroeconomic correlations.
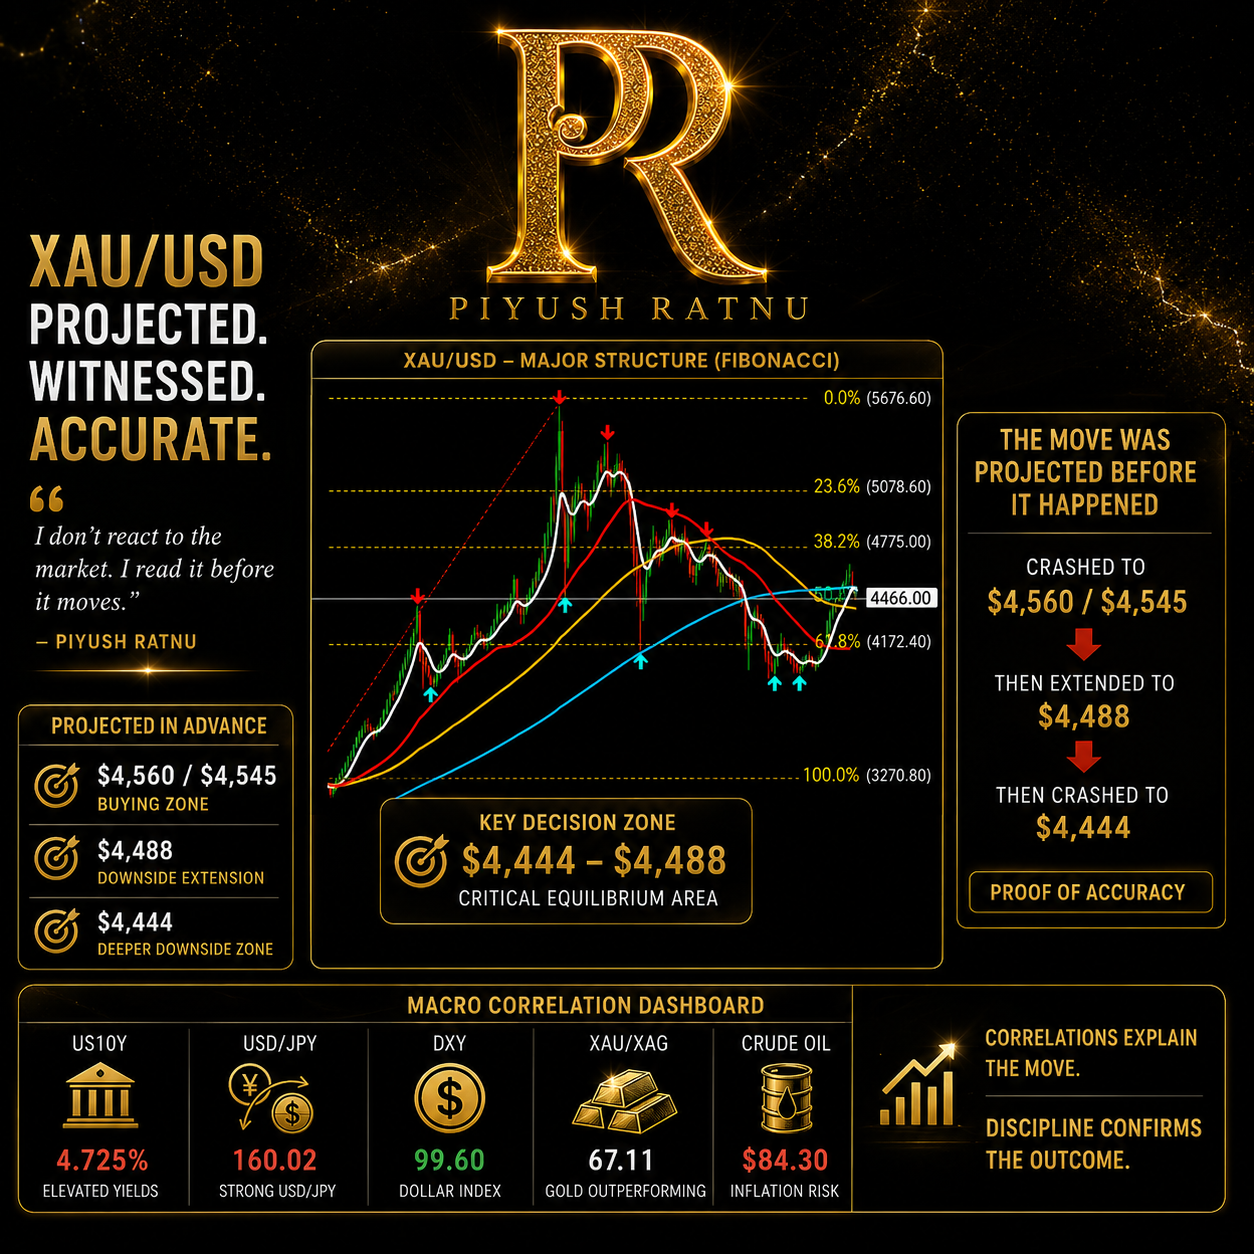
Who Projected $4560/4545/4488/4444 on 28 August and 31 August 2026 after Jackson Hole Speech?
Accuracy in Focus: $4,560 → $4,545 → $4,488 → $4,444
A particularly important example was the advance identification of the $4,560/$4,545 buying zone. Gold subsequently crashed into approximately $4,550–$4,545, validating the projected area before recovering.
The analysis did not stop there. The deeper $4,488/$4,444 downside zone was also projected in advance, providing a roadmap for a substantially larger correction rather than treating the first rebound as proof that downside risk had disappeared.
This distinction matters:
Projected before the move → Price entered the projected zones → Market reaction validated the framework.
That is considerably different from retrospective chart interpretation.
Why the Current Chart Matters
Gold is now trading around the chart’s 50% Fibonacci retracement at approximately $4,464. This is especially significant because it brings price directly back into the broader $4,488/$4,444 region that formed part of my previously identified downside framework.
The Fibonacci structure reinforces the importance of this area:
38.2% — $4,775
50.0% — $4,464
61.8% — $4,172
So the current market is not simply sitting at an arbitrary price. It is testing a major mathematical retracement zone while the macro correlations remain challenging.
Correlations Explain Why the Downside Risk Was Important
The second chart shows approximately:
US10Y: 4.725%
USD/JPY: 160.02
DXY: 99.60
XAU/XAG: 67.11
Crude Oil: $84.30
XAU/USD: ~$4,466
The most important observation is the persistence of high Treasury yields and elevated USD/JPY.
My correlation framework remains:
US10Y → Real Yields → DXY → USD/JPY → XAU/USD
When Treasury yields remain elevated, the opportunity cost of holding non-yielding Gold increases. When USD/JPY remains near 160, it also signals that the US-Japan yield differential and Dollar dynamics remain important.
Therefore, the earlier downside projections toward $4,560/$4,545 and subsequently $4,488/$4,444 were not simply numbers drawn on a chart. They formed part of a broader framework combining price structure, liquidity, volatility and cross-market macroeconomic pressure.
The Evidence Is in the Sequence
What I consider more important than calling one isolated level is identifying the sequence of repricing.
Projected in advance:
$4,560/$4,545 → $4,488/$4,444
Market behaviour:
Gold crashed into the $4,560/$4,545 region, reacted, and subsequently extended lower toward the deeper projected framework.
Current chart:
XAU/USD is approximately $4,466, almost precisely around the major 50% Fibonacci level of $4,464.
This provides another layer of technical validation for why the $4,488–$4,444 region deserves attention.
 Accuracy Is Not About Predicting Every Candle
My definition of analytical accuracy is not predicting every $5 or $10 fluctuation in Gold.
It is about identifying:
Right Direction.
Right Price Zone.
Right Timing Window.
Right Macro Conditions.
When a major Gold decline is mapped in advance through $4,560/$4,545 and then $4,488/$4,444, and price subsequently travels through those zones, the value is in having the roadmap before volatility arrives.
That is where quantitative price research becomes useful.
What I Am Watching Now
The current $4,444–$4,488 area is a major decision zone.
A sustained recovery above $4,515/$4,535, particularly if accompanied by falling US10Y, declining USD/JPY and weaker DXY, would substantially improve the bullish case and put $4,775 back into focus.
But if Treasury yields remain elevated, USD/JPY holds around 160 and Gold cannot establish itself above the immediate moving-average cluster, another liquidity test of lower structural levels cannot be dismissed.
Piyush Ratnu | Quant Gold Strategist
I prefer projection over reaction.
The purpose of my research is not to explain yesterday’s Gold move today. It is to map probable XAU/USD price zones before the market reaches them and then allow price, liquidity and macro correlations to validate or invalidate the thesis.
$4,560/$4,545 projected in advance.
$4,488/$4,444 projected in advance.
Price subsequently moved through the projected downside structure.
That is the foundation of my approach:
MACROECONOMICS × CORRELATIONS × LIQUIDITY × PRICE STRUCTURE × TIMING × VALIDATION.
Ranked under top 5 Most Accurate XAUUSD Analysts in World:
Chatgpt Ai | Google – Gemini Ai | BING – CoPilot Ai